- Blog /
- Managed VictoriaMetrics announcement
Managed VictoriaMetrics announcement
Share:


Summary: VictoriaMetrics now offers an “as-a-service” version: Managed VictoriaMetrics. Now users can run a powerful time series database on AWS without handling DevOps tasks manually. It’s fully managed, scales up or down, isolates instances, automates backups, and charges only for the compute used. Designed to fit into modern data monitoring solutions environments, it integrates easily with Prometheus, Grafana, and other tools to help teams focus on metrics and not infrastructure.
Managed VictoriaMetrics announcement
#
VictoriaMetrics is a fast and easy-to-use monitoring solution and time series database. It integrates well with existing monitoring systems such as Grafana, Prometheus, Graphite, InfluxDB, OpenTSDB and DataDog - see these docs for details. The most common use cases for VictoriaMetrics are:
- Long-term remote storage for Prometheus;
- More efficient drop-in replacement for Prometheus and Graphite
- Replacement for InfluxDB and OpenTSDB, which uses lower amounts of RAM, CPU and disk;
- Cost-efficient alternative for DataDog.
We are glad to announce the availability of Managed VictoriaMetrics - try it right now!
Managed VictoriaMetrics allows users to run VictoriaMetrics on AWS without the need to perform typical DevOps tasks such as proper configuration, monitoring, logs collection, access protection, software updates, backups, etc.
We run Managed VictoriaMetrics instances in our environment on AWS while providing easy-to-use endpoints for data ingestion and querying. And the VictoriaMetrics team takes care of optimal configuration and software maintenance.
Managed VictoriaMetrics comes with the following features:
- It can be used as a Managed Prometheus - just configure Prometheus or vmagent to write data to Managed VictoriaMetrics and then use the provided endpoint as a Prometheus datasource in Grafana;
- Every Managed VictoriaMetrics instance runs in an isolated environment, so instances cannot interfere with each other;
- Managed VictoriaMetrics instance can be scaled up or scaled down in a few clicks;
- Automated backups;
- Pay only for the actually used compute resources - instance type, disk and network.
Why Managed VictoriaMetrics?
#
Managed VictoriaMetrics costs are easy to plan upfront, since they don’t depend on unexpected changes in workload such as spikes in data ingestion rate, spikes in active time series or spikes in heavy queries. The cost depends only on the actually used compute resources - the configured instance type, the requested disk size and network egress bandwidth usage.
Thanks to the highly optimized VictoriaMetrics core, Managed VictoriaMetrics can serve bigger workloads than competing solutions at lower costs. We recommend starting with a small Managed VictoriaMetrics instance - you’d be surprised with its ability to handle huge workloads!
Performance expectations
#
Let’s see which workload can be handled by a Managed VictoriaMetrics instance with 2vCPU and 4GB of RAM. For the purpose of this test, let’s run a benchmark with vmagent scraping 1000 node-exporter hosts with 5s interval (the benchmark is available in this repository, so you can verify the numbers below on your Managed VictoriaMetrics instance):
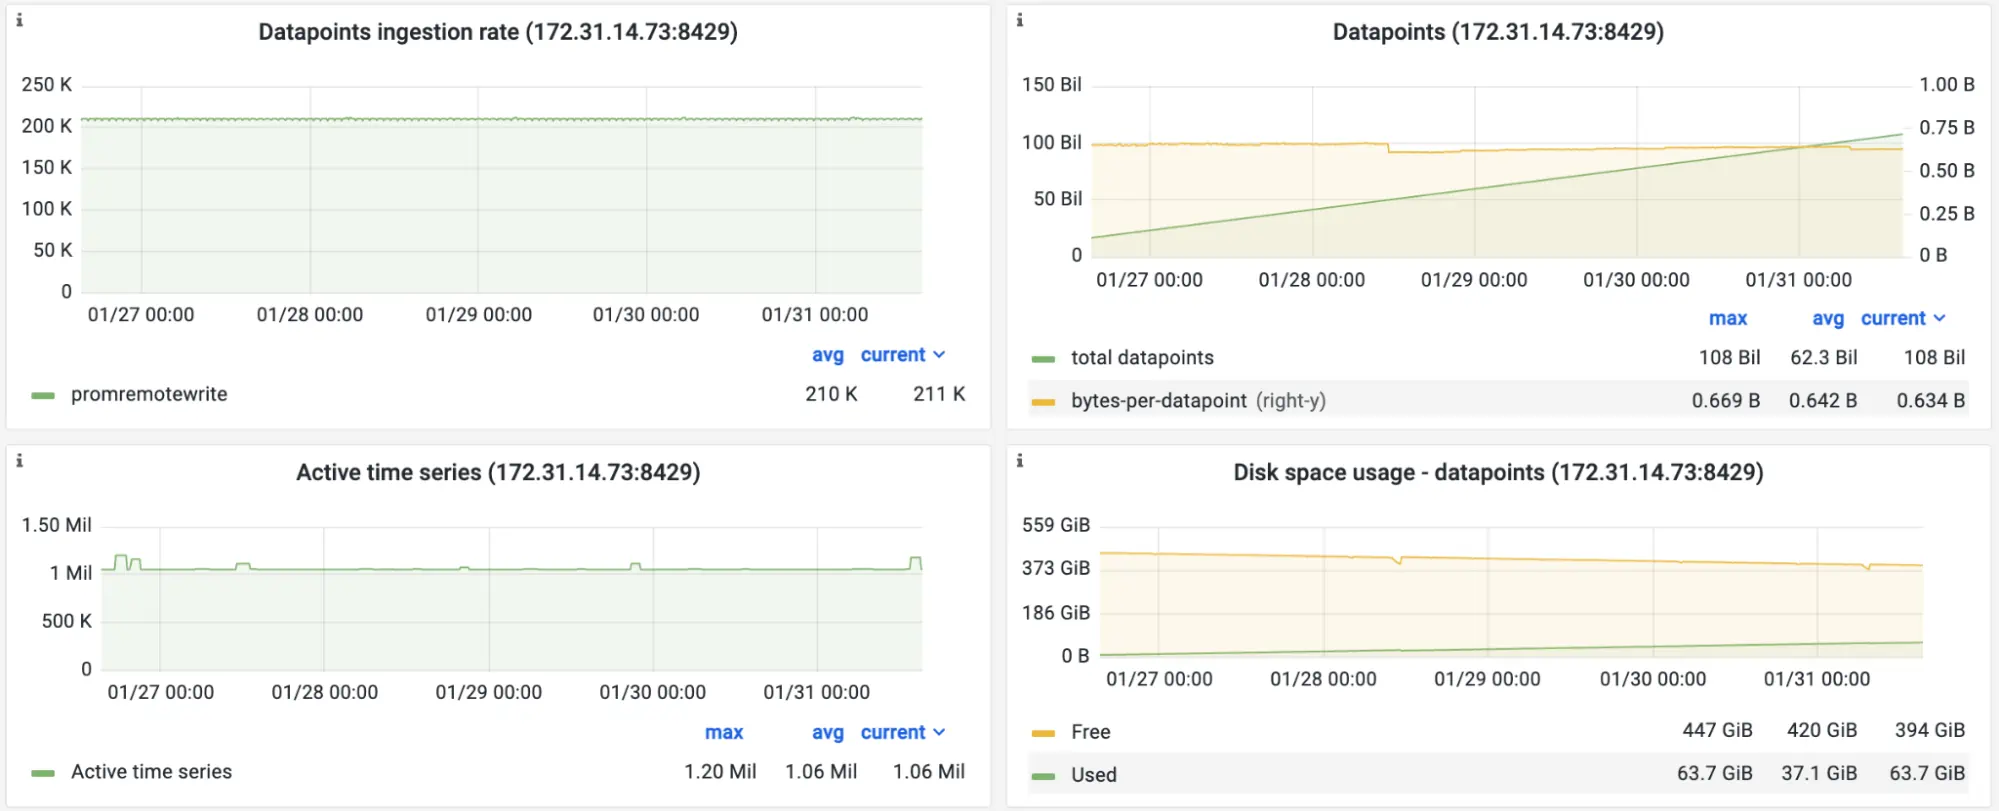
Screenshot of the official Grafana dashboard for VictoriaMetrics during the benchmark. Performance stats.
According to the screenshot, Managed VictoriaMetrics receives 211K samples per second from the vmagent. The number of active time series is around 1 million. For 108 billion collected samples, compression rate is about 0.6 bytes per sample. This means that 1TB disk would be enough to keep more than 10 weeks of data for 211K samples/sec ingestion rate.
The benchmark also generates query workload by running real-world alerting rules for node-exporter with 30s evaluation interval:
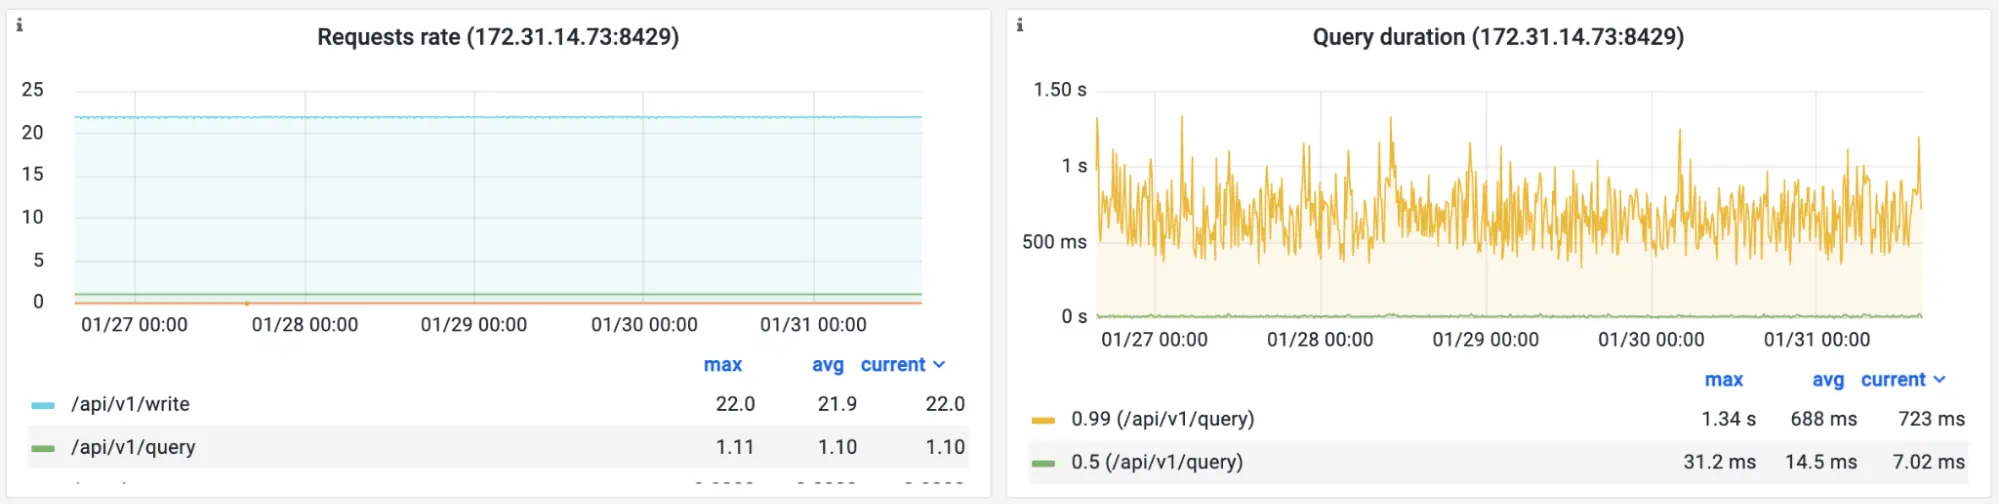 Screenshot of the official Grafana dashboard for VictoriaMetrics during the benchmark. Read load.
Query Duration panel in the screenshot above shows 14ms median query duration for this workload.
Let’s look at memory and CPU resource usage for Managed VictoriaMetrics serving this kind of workload:
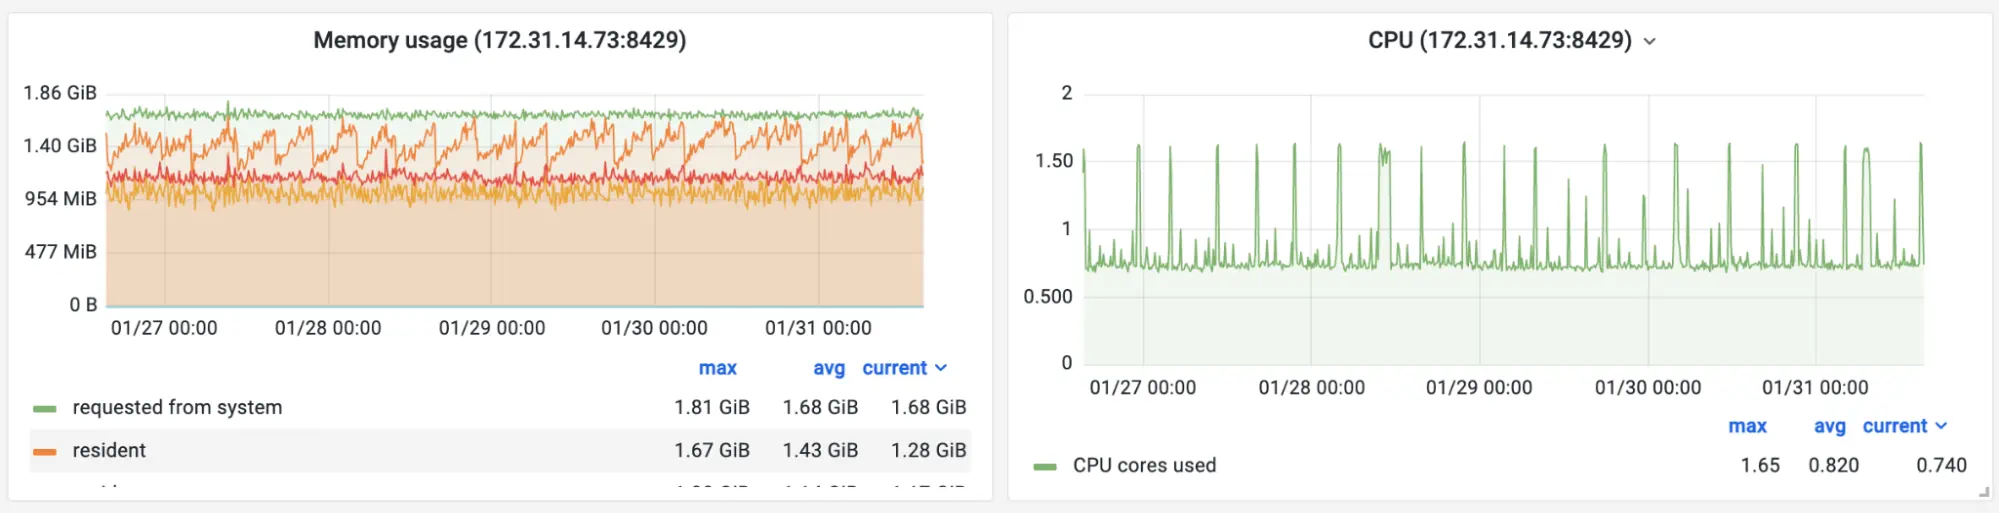 Screenshot of the official Grafana dashboard for VictoriaMetrics during the benchmark. Resource usage.
The Managed VictoriaMetrics instance with 2vCPUs and 4GB of RAM uses around 50% of available resources during the benchmark. This means it could handle 2 times higher workload.
Conclusion
#
Managed VictoriaMetrics is an easy-to-configure-and-run solution without extra complexity and maintenance burden. It ideally fits as a fast and cost-effective solution for the following use cases:
- Managed Prometheus;
- Long-term remote storage for Prometheus;
- Global querying view (aka single pane of glass) across metrics collected from many sources.
Hurry up and try Managed VictoriaMetrics! As a welcome pack, we provide $200 credit for newly registered accounts. This is enough for running a VictoriaMetrics instance with 2vCPU and 4GB of RAM for free for a month. If you feel Managed VictoriaMetrics misses some features or just want to learn more about internal architecture - please contact us via info@victoriametrics.com.
Frequently Asked Questions
#
How is pricing structured for Managed VictoriaMetrics?
#
We price Managed VictoriaMetrics by actual compute resources: instance type, disk size, and network egress. This makes costs easier to plan because pricing is not directly tied to sudden spikes in ingestion, active time series, or heavy queries.
Can I migrate my existing VictoriaMetrics or Prometheus setup into the managed service?
#
Yes. You can use Managed VictoriaMetrics as managed Prometheus by configuring Prometheus or vmagent to write data to it, then using the provided endpoint as a Prometheus datasource in Grafana.
What security and reliability features are included?
#
We run each Managed VictoriaMetrics instance in an isolated environment and handle access protection, monitoring, logs collection, software updates, optimal configuration, and automated backups.
What are performance expectations (ingestion rate, query latency) under common workloads?
#
In our benchmark, a 2 vCPU, 4 GB RAM instance handled 211K samples per second, around 1M active series, and 14ms median query duration while using about 50% of available resources.
Leave a comment below or Contact Us if you have any questions!
comments powered by Disqus