- Blog /
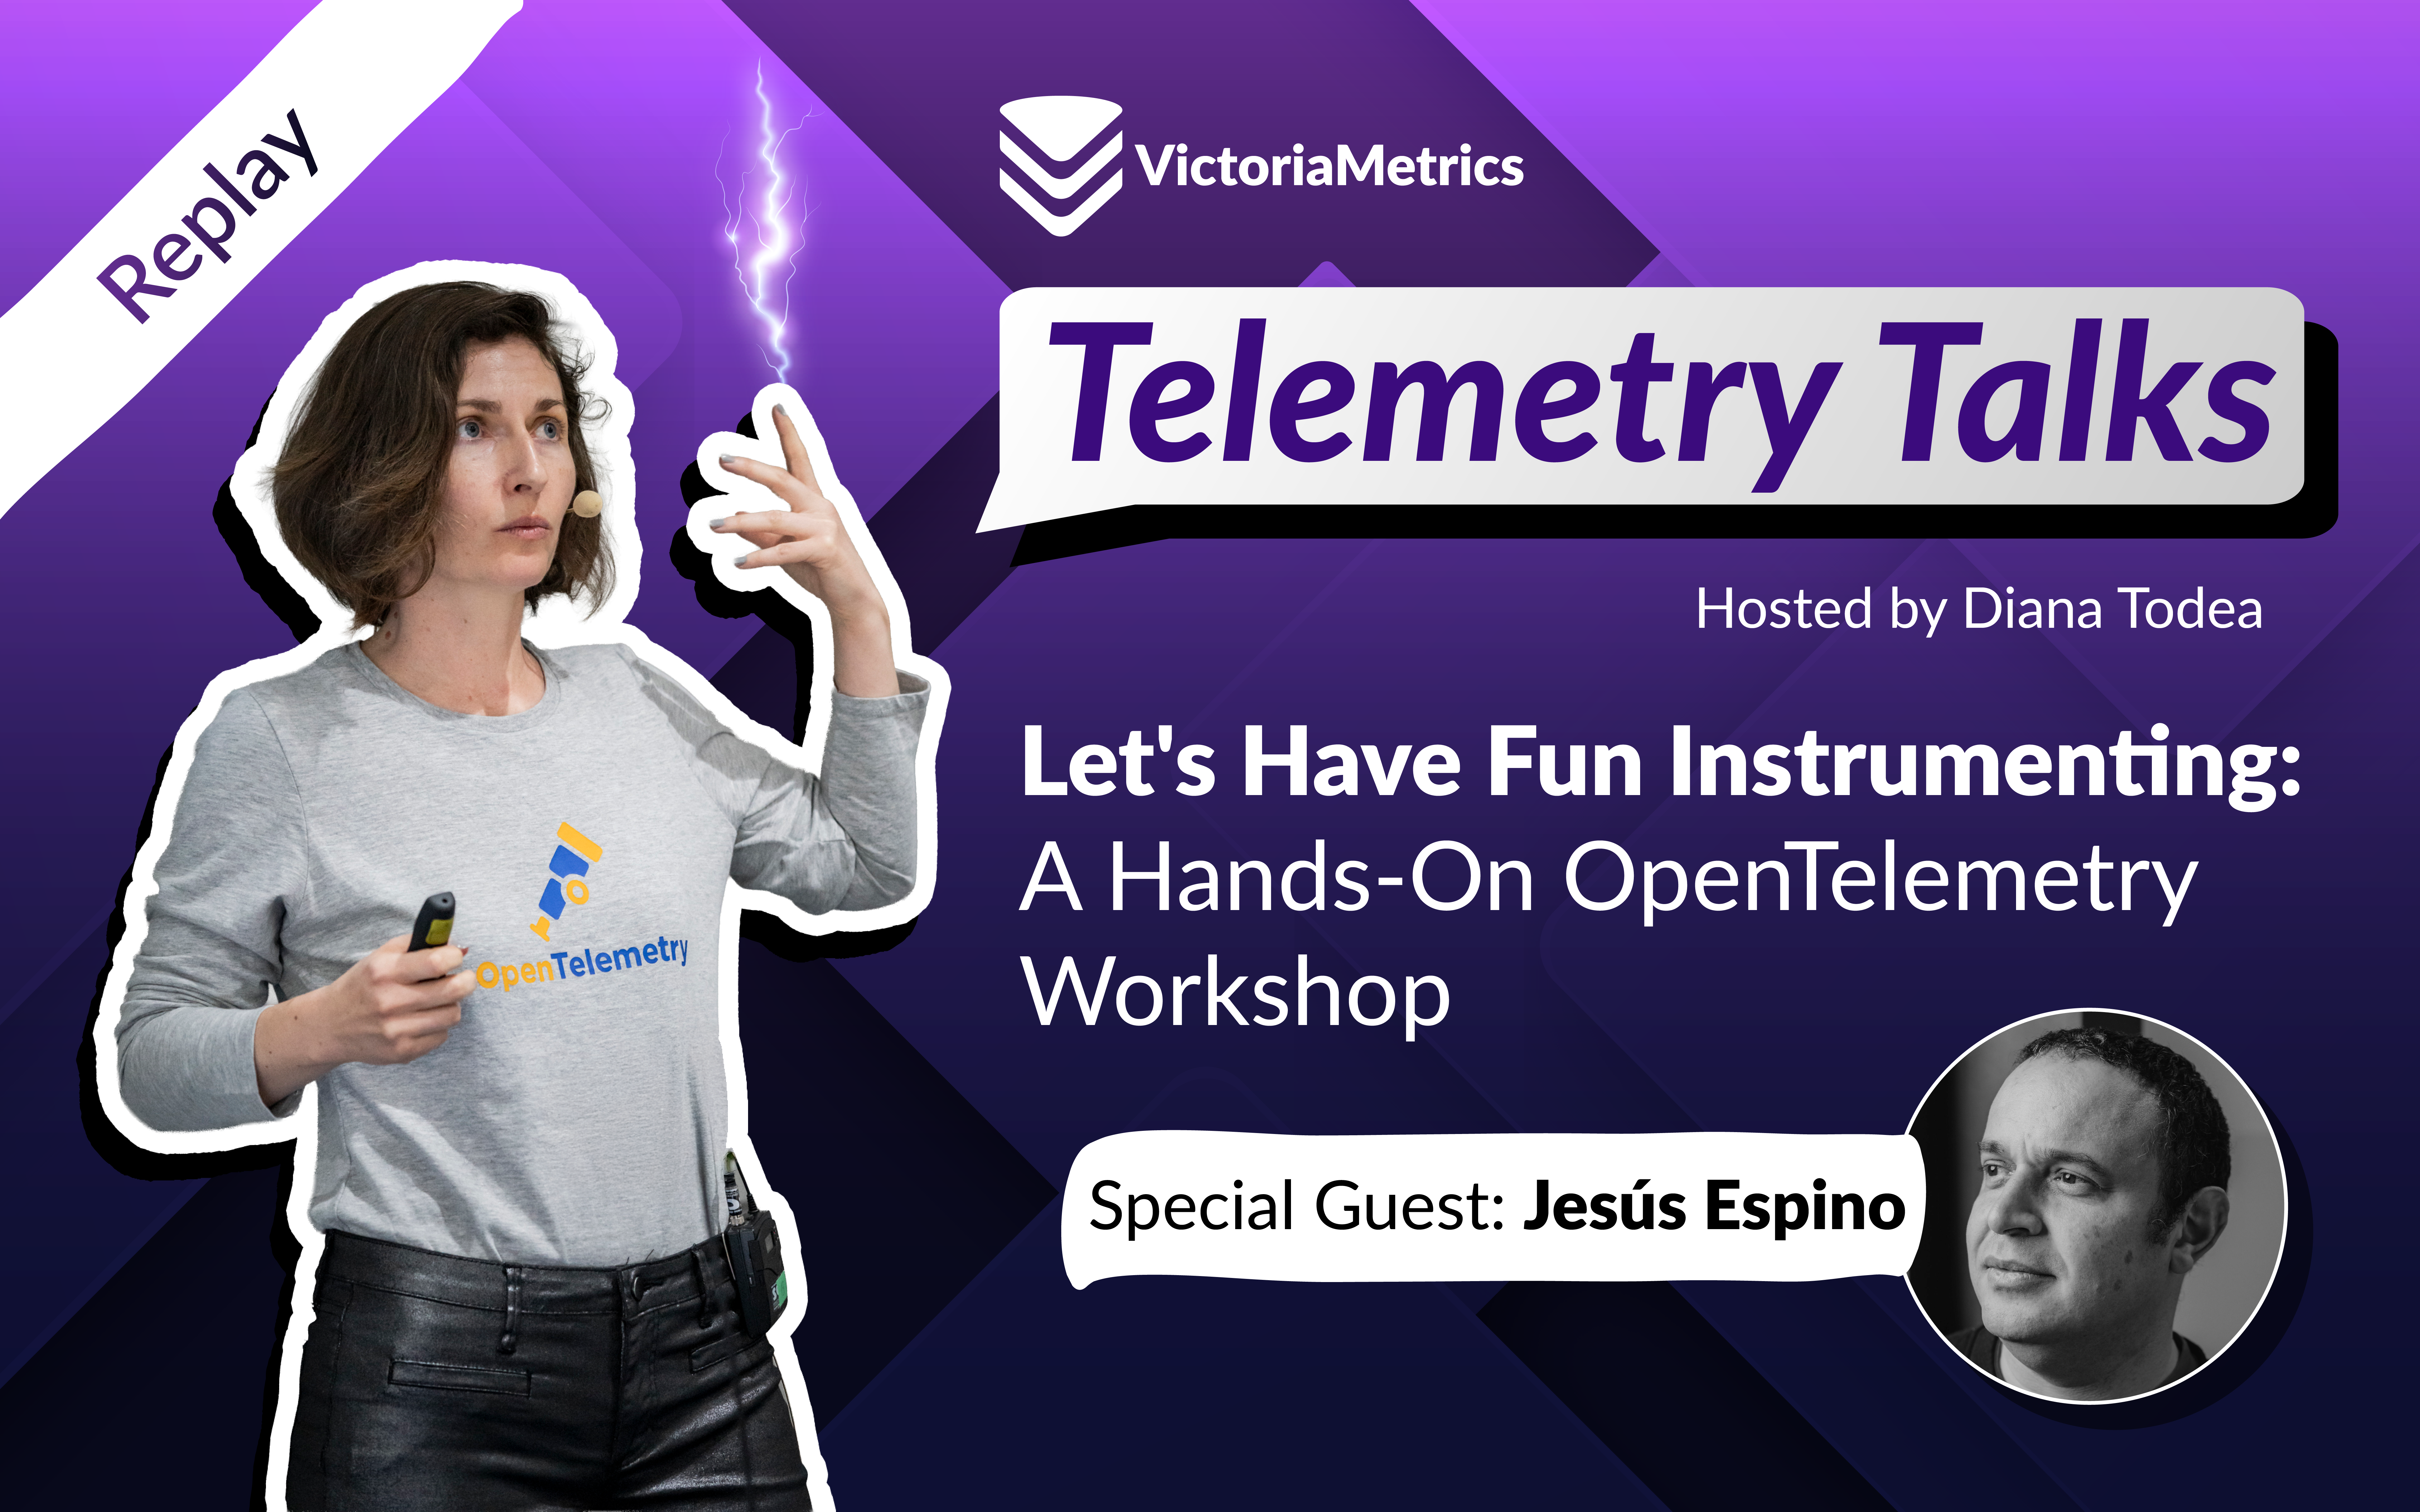
- Let's Have Fun Instrumenting: A Hands-On OpenTelemetry Workshop
Let's Have Fun Instrumenting: A Hands-On OpenTelemetry Workshop
Share:


Summary: Getting started with OpenTelemetry can be challenging, from instrumenting applications to building telemetry pipelines and troubleshooting production issues. In Telemetry Talks Episode 9, Jesús Espino introduces his hands-on OpenTelemetry workshop, available in English and Spanish. In this article, we explore automatic and manual instrumentation, the OpenTelemetry Collector, and how metrics, logs, and traces work together to improve application observability. We also discuss production considerations such as performance overhead, cardinality, sampling, and telemetry costs, along with practical ways to start experimenting and contributing to the OpenTelemetry community.
OpenTelemetry has become an important part of modern observability, providing open standards and tools for generating, collecting, and exporting telemetry. But getting started with OpenTelemetry can still feel overwhelming. Between SDKs, automatic instrumentation, the Collector, and multiple telemetry signals, it’s not always straightforward to understand how everything fits together.
And even once telemetry is flowing, another question emerges: how do we turn that data into something useful for troubleshooting applications?
To explore these questions, I recently welcomed Jesús Espino, Principal Software Engineer at VictoriaMetrics, to our Telemetry Talks podcast to discuss his hands-on OpenTelemetry workshop. In his workshop, he guides developers through instrumenting an application, building a telemetry pipeline, and investigating application behavior using metrics, logs, and traces.
Learning OpenTelemetry by building an observability pipeline
#
One challenge of learning observability is that individual concepts are often introduced separately. Developers learn about metrics, traces, logging, and telemetry collection, but don’t necessarily see how these components work together in a running application.
Jesús’s workshop addresses this by taking a practical approach: participants start with an application that has no OpenTelemetry instrumentation and progressively add the components needed to observe its behavior.
The workshop supports three programming languages: JavaScript (Node.js/Express), Python (Flask), and Go. Each track uses the same application architecture and observability backend, so participants can focus on instrumentation rather than differences between tools.
The environment runs locally using Docker Compose and includes a multi-service to-do application, PostgreSQL, the OpenTelemetry Collector, and an observability stack consisting of VictoriaMetrics, VictoriaLogs, VictoriaTraces, and Grafana.
I really enjoy that this workshop is available in both English and Spanish, making the learning materials accessible to a broader international audience.
Across nine modules, participants learn how to:
- Instrument an application automatically and manually.
- Generate and collect metrics, logs, and traces.
- Configure an OpenTelemetry Collector.
- Investigate application behavior through telemetry queries.
- Understand the trade-offs involved in running OpenTelemetry in production.
With approximately 75% of the workshop dedicated to hands-on exercises, the emphasis is on experimentation rather than theory. You can follow the exercises independently using the workshop repository or the online workshop materials.
Where should developers start with instrumentation?
#
Application instrumentation is the foundation of OpenTelemetry. Without it, the telemetry pipeline has little information about what an application is doing internally.
However, developers don’t necessarily need to start by modifying application code.
OpenTelemetry supports two complementary approaches: automatic and manual instrumentation.
Automatic instrumentation: Start with what is already available
#
Automatic instrumentation uses existing instrumentation libraries or language-specific mechanisms to capture common application operations without requiring developers to manually create every metric or span.
Depending on the language and supported frameworks, this can include HTTP requests, database operations, and calls to external services.
For example, instrumenting a web application may automatically produce traces showing incoming requests and the database queries they trigger.
This provides a useful starting point for understanding request latency, error rates, and service dependencies.
In Module 4 of the workshop, participants explore zero-code instrumentation and begin generating telemetry before adding application-specific instrumentation.
Automatic instrumentation is particularly useful when developers want initial visibility into an application without making extensive source-code changes.
However, it has limitations.
A framework may know that an HTTP request took 500 milliseconds. Still, it doesn’t necessarily know whether that request created a new order, processed a payment, or performed another meaningful business operation.
This is where manual instrumentation becomes important.
Manual instrumentation: Add the context that matters
#
Manual instrumentation allows developers to explicitly define the telemetry they need.
For metrics, this might mean tracking the number of successfully processed transactions or measuring the duration of a specific operation.
For tracing, it could mean creating custom spans around important business logic.
For logging, it might involve adding structured attributes and trace context so that log records can be associated with individual requests.
The workshop introduces these concepts progressively through dedicated exercises on manual metrics, logs, and traces.
The important distinction is that automatic and manual instrumentation are not competing approaches.
Automatic instrumentation provides a baseline, while manual instrumentation adds the application-specific information needed to answer operational questions.
A good starting point is to identify the questions you want your telemetry to answer, then determine whether existing instrumentation already provides the necessary information.
For further guidance, explore the official OpenTelemetry instrumentation documentation.
From application to backend: Understanding the telemetry pipeline
#
Once an application starts generating telemetry, the next step is getting that data into an observability backend.
OpenTelemetry separates instrumentation from the systems used to store and analyze telemetry. This allows applications to produce telemetry using open standards without depending on a particular backend.
A typical pipeline looks like this:
Instrumented application → OpenTelemetry Collector → Observability backend
The application uses an OpenTelemetry SDK or instrumentation library to generate telemetry and export it, commonly using the OpenTelemetry Protocol (OTLP).
OTLP supports transmitting metrics, logs, and traces, providing a common communication protocol between components.
The OpenTelemetry Collector can sit between applications and their destinations, providing a central place to receive, process, and export telemetry.
What does the OpenTelemetry Collector actually do?
#
The Collector is organized around several core components:
Receivers accept telemetry from applications or other sources. For example, an OTLP receiver can accept telemetry sent by OpenTelemetry SDKs.
Processors modify or control telemetry as it passes through the pipeline. They can batch data, filter unwanted information, transform attributes, or apply memory-management controls.
Exporters send telemetry to downstream systems, including observability backends or other Collectors.
These components are connected through pipelines, typically configured separately for metrics, logs, and traces.
The Collector isn’t mandatory for every OpenTelemetry deployment, but it’s especially useful when teams need centralized processing, consistent configuration, or the flexibility to change telemetry destinations.
In Module 5, Jesús introduces the Collector and explains how it handles the telemetry generated by the workshop application.
Where VictoriaMetrics fits into the pipeline
#
The workshop uses the VictoriaMetrics observability stack to store and explore the generated telemetry.
Each backend handles a different signal:
- VictoriaMetrics stores and queries metrics, supporting Prometheus-compatible monitoring workflows.
- VictoriaLogs stores and queries logs using LogsQL.
- VictoriaTraces stores and queries distributed traces.
Because the application is instrumented with OpenTelemetry, its instrumentation isn’t tied to these specific storage components.
This separation is one of OpenTelemetry’s main architectural advantages: developers can instrument applications using common APIs and conventions while infrastructure teams choose how telemetry is collected, processed, and stored.
The workshop demonstrates this separation through a complete working environment rather than isolated configuration examples.
Troubleshooting applications with metrics, logs, and traces
#
Collecting telemetry is only the first step. The real value comes from using it to understand application behavior and investigate problems.
Metrics, logs, and traces provide complementary perspectives on a system.
Consider an application where users are experiencing slow requests.
Start with metrics: What is happening?
#
Metrics can reveal changes in application behavior over time.
For example, a dashboard might show that request latency has increased while the number of incoming requests remains stable.
This suggests that the slowdown may not simply be caused by increased traffic.
Metrics help identify patterns, establish baselines, and determine when an issue started.
However, they generally don’t explain the complete execution path of an individual request.
Follow the traces: Where is the problem?
#
Distributed traces show how a request travels through an application and its dependencies.
A trace consists of spans that represent individual operations, such as handling an HTTP request, executing a database query, or calling another service.
If a request takes two seconds to complete, its trace may reveal that most of that time was spent waiting for a database operation.
Developers can then narrow their investigation to the relevant component.
In the workshop, participants learn how to create custom spans, record errors, and propagate trace context across services.
Examine the logs: What additional context is available?
#
Logs provide details about events occurring inside the application.
Structured logs make these details easier to query by storing relevant information as fields rather than relying entirely on unstructured text.
When logs contain valid trace and span identifiers, they can also be associated with the corresponding trace.
This makes it possible to move from a slow request to the application events recorded during its execution, provided the relevant telemetry and query integrations are configured.
For example, a trace might reveal a slow database operation, while the associated logs provide additional details about a timeout or failed operation.
Together, these signals support a more focused investigation.
Metrics help identify symptoms, traces show where time is spent, and logs provide additional context about what happened.
This is also why consistent resource attributes, such as service names, and proper context propagation matter. Without them, connecting telemetry across services becomes much more difficult.
The workshop’s practical exercises demonstrate how developers can progressively add this context and use the resulting telemetry to understand the application.
From workshop to production: What changes?
#
A local workshop environment makes experimentation easy. Production environments introduce different constraints.
Applications may process thousands of requests per second, run across multiple clusters, or generate telemetry from hundreds of services.
At that scale, instrumentation and telemetry processing become operational concerns in their own right.
The final workshop module introduces several considerations that developers should evaluate before deploying OpenTelemetry in production.
1. Instrumentation and processing overhead
#
Telemetry is not free.
Generating spans, recording metrics, processing logs, and exporting data all consume resources.
The impact depends on instrumentation configuration, application workload, the number of attributes recorded, and the volume of telemetry exported.
The Collector also requires CPU and memory to receive, process, and export data.
For production deployments, teams should measure this overhead rather than assume default configurations fit every workload.
2. Metric cardinality
#
Cardinality is another important consideration, particularly for metrics.
A metric can generate multiple time series depending on the number of unique combinations of its attributes.
For example, a metric tracking HTTP requests by method and status code may have a manageable number of combinations.
Adding an attribute containing a unique request ID, however, could create a new time series for nearly every request.
This increases the number of time series the monitoring system must handle, potentially affecting memory usage, storage requirements, and query performance.
Before adding attributes to metrics, developers should consider whether those attributes have bounded values and whether they are useful for aggregation.
Unique identifiers are generally better suited to traces or logs than metric labels.
The workshop introduces cardinality during its manual metrics exercises, helping participants understand why instrument selection and attribute design matter.
3. Sampling and filtering
#
Not every piece of telemetry needs to be retained indefinitely.
Sampling allows teams to control the volume of trace data collected or exported.
Head sampling makes decisions early in the trace lifecycle, while tail sampling can evaluate completed traces before deciding which ones to retain.
These approaches involve different trade-offs around resource consumption, trace completeness, and the information available when making sampling decisions.
Filtering provides another way to reduce telemetry volume by removing unnecessary data.
However, reducing telemetry too aggressively can make troubleshooting harder, particularly when important information is discarded before an incident occurs.
The objective is not simply to collect less data, but to retain the information needed to answer meaningful operational questions.
The OpenTelemetry sampling documentation provides further details.
4. Telemetry costs and data retention
#
As applications scale, telemetry volume can become a significant operational and financial consideration.
Several factors influence costs, including the amount of data generated, network transfer, processing requirements, storage, and retention periods.
Different telemetry signals also have different characteristics.
Metrics are typically aggregated time series, traces represent individual operations, and logs can vary considerably in size and structure.
A practical production strategy should consider which signals are necessary, how much detail they require, and how long that information remains useful.
This is also an opportunity to review instrumentation itself.
Reducing unnecessary spans or high-cardinality attributes at the source can be more effective than generating excessive telemetry and discarding it later.
5. Privacy and sensitive information
#
Production instrumentation must also account for sensitive data.
Telemetry attributes, log messages, and span events can unintentionally contain personal information, credentials, or other confidential values.
Teams should establish clear rules about what data is permitted in telemetry and where sensitive information should be removed.
Collector processors can help enforce some of these rules, but preventing sensitive information from being recorded in the first place is generally preferable.
Common mistakes when getting started with OpenTelemetry
#
Learning OpenTelemetry involves more than configuring an SDK and seeing data appear in a dashboard.
Several mistakes can make an otherwise functional telemetry pipeline difficult to operate or troubleshoot.
One is assuming that automatic instrumentation provides complete visibility. It offers a useful foundation, but developers still need to identify which application-specific operations deserve additional instrumentation.
Another is collecting telemetry without a clear purpose. More metrics, spans, and logs don’t automatically mean better observability.
Inconsistent service names and missing resource attributes can also make it difficult to identify which application or deployment produced particular telemetry.
Finally, teams sometimes treat a successful local deployment as proof that the same configuration is ready for production.
A workshop configuration helps participants understand the components. Production deployments require additional decisions around reliability, performance, security, and resource management.
A useful approach is to start with a small set of operational questions, instrument the application to answer them, and then evaluate whether the resulting telemetry is sufficient.
OpenTelemetry lets you expand instrumentation incrementally, without requiring every application to adopt the same level of detail from the beginning.
Continue learning and contributing to OpenTelemetry
#
Completing a workshop is a useful starting point, but OpenTelemetry is also an open-source community with many opportunities to learn and contribute.
The official OpenTelemetry documentation provides language-specific instrumentation guides, Collector configuration examples, and explanations of the project’s core concepts.
For developers who want to see how the project evolves, OpenTelemetry development happens openly through its GitHub organization.
The project is organized into Special Interest Groups (SIGs), each focused on a different area of the ecosystem.
For example, language-specific SIGs maintain instrumentation libraries and SDKs, while the Collector SIGs work on telemetry collection and processing components.
The Documentation SIG helps maintain and improve the official learning materials, including tutorials and getting-started guides.
Contributing doesn’t necessarily require writing complex code. Documentation improvements, testing examples, reporting reproducible issues, and reviewing pull requests are all useful ways to participate.
A practical first contribution might be identifying something confusing while completing the workshop, checking whether the official documentation covers it, and proposing a clarification.
You can find current groups, meeting details, and community resources on the OpenTelemetry community page.
Ready to get hands-on with OpenTelemetry?
#
The best way to understand OpenTelemetry is to experiment. Clone Jesús’s workshop repository, choose your preferred language, and start instrumenting an application.
Prefer the video version? Watch Telemetry Talks, Episode 9: Let’s Have Fun Instrumenting with OpenTelemetry, where Jesús walks us through the workshop and discusses common challenges when adopting OpenTelemetry.
And if you enjoy the workshop, consider contributing to it! The project is open source, and you can extend its reach by adding examples for additional OpenTelemetry SDKs, supporting more programming languages, translating the materials into languages beyond English and Spanish, or improving the existing exercises and documentation.
Frequently Asked Questions (FAQs)
#
1. What is the best way to get started with OpenTelemetry?
#
The best way to learn OpenTelemetry is through hands-on experimentation. Start by instrumenting a simple application, generating metrics, logs, and traces, and exporting them to an observability backend. Jesús Espino’s OpenTelemetry workshop, featured in Telemetry Talks Episode 9, provides practical exercises in Go, Python, and JavaScript, with materials available in English and Spanish.
2. What is the difference between automatic and manual instrumentation in OpenTelemetry?
#
Automatic instrumentation captures common application operations, such as HTTP requests and database queries, without requiring extensive code changes. Manual instrumentation allows developers to add application-specific metrics, spans, and contextual information. Both approaches complement each other: automatic instrumentation provides baseline visibility, while manual instrumentation adds the details needed for effective troubleshooting.
3. What does the OpenTelemetry Collector do?
#
The OpenTelemetry Collector receives, processes, and exports telemetry data, including metrics, logs, and traces. It uses receivers, processors, and exporters to build configurable telemetry pipelines. The Collector helps teams manage telemetry centrally, apply filtering or batching, and send data to observability backends such as VictoriaMetrics, VictoriaLogs, and VictoriaTraces.
4. How do metrics, logs, and traces work together in OpenTelemetry?
#
Metrics help identify performance trends and anomalies, traces show how requests move through distributed applications, and logs provide detailed context for individual events. Together, these three telemetry signals help developers investigate application issues, identify bottlenecks, and understand system behavior more effectively.
5. What are the main challenges of using OpenTelemetry in production?
#
Common production challenges include instrumentation overhead, high metric cardinality, excessive telemetry volume, storage costs, and exposure of sensitive data. Developers should carefully design telemetry attributes, evaluate sampling and filtering strategies, configure Collector resource limits, and establish appropriate data retention policies. The goal is to collect useful telemetry while maintaining application performance and controlling operational costs.
Leave a comment below or Contact Us if you have any questions!
comments powered by Disqus
You might also like:
Finding Why Payments Fail with VictoriaLogs Drilldown
The VictoriaLogs data source for Grafana now ships with Drilldown, a point-and-click way to explore logs without writing queries. In this post, we use it to investigate failing payments in the OpenTelemetry demo shop, going from a single warning to the release, the log message, and the line of code behind it, all without typing a line of LogsQL.
What Is Observability? It’s More Than Metrics, Logs, and Traces
Observability is a practice, not a product. Learn how metrics, logs, traces, and OpenTelemetry help engineers investigate problems and understand their systems.
Observability's Sixth Sense: Grounding Anomaly Detection in Reality
Learn how VictoriaMetrics combines machine learning, MCP, and natural-language workflows to simplify observability with anomaly detection and reduce operational overhead.