- Blog /
- Container CPU Requests & Limits Explained with GOMAXPROCS Tuning

Container CPU Requests & Limits Explained with GOMAXPROCS Tuning
Share:


In this article, we’re going to cover a few things that might’ve puzzled you if you’ve been running your applications, especially Go applications, in Kubernetes:
- How Kubernetes and the Linux kernel handle CPU stuff for containers
- What the Go runtime does with CPU, and whether you should bother setting
GOMAXPROCS - Which metrics are actually worth paying attention to
Maybe you’ve seen some of these metrics before while keeping an eye on your applications, but didn’t fully know what to make of them. This should help clear that up.
Overview of cgroups
#
Kubernetes uses something called cgroups (short for control groups) to manage and keep resource usage in check—things like CPU and memory—for every pod and container on a node. Think of it like a layered structure:
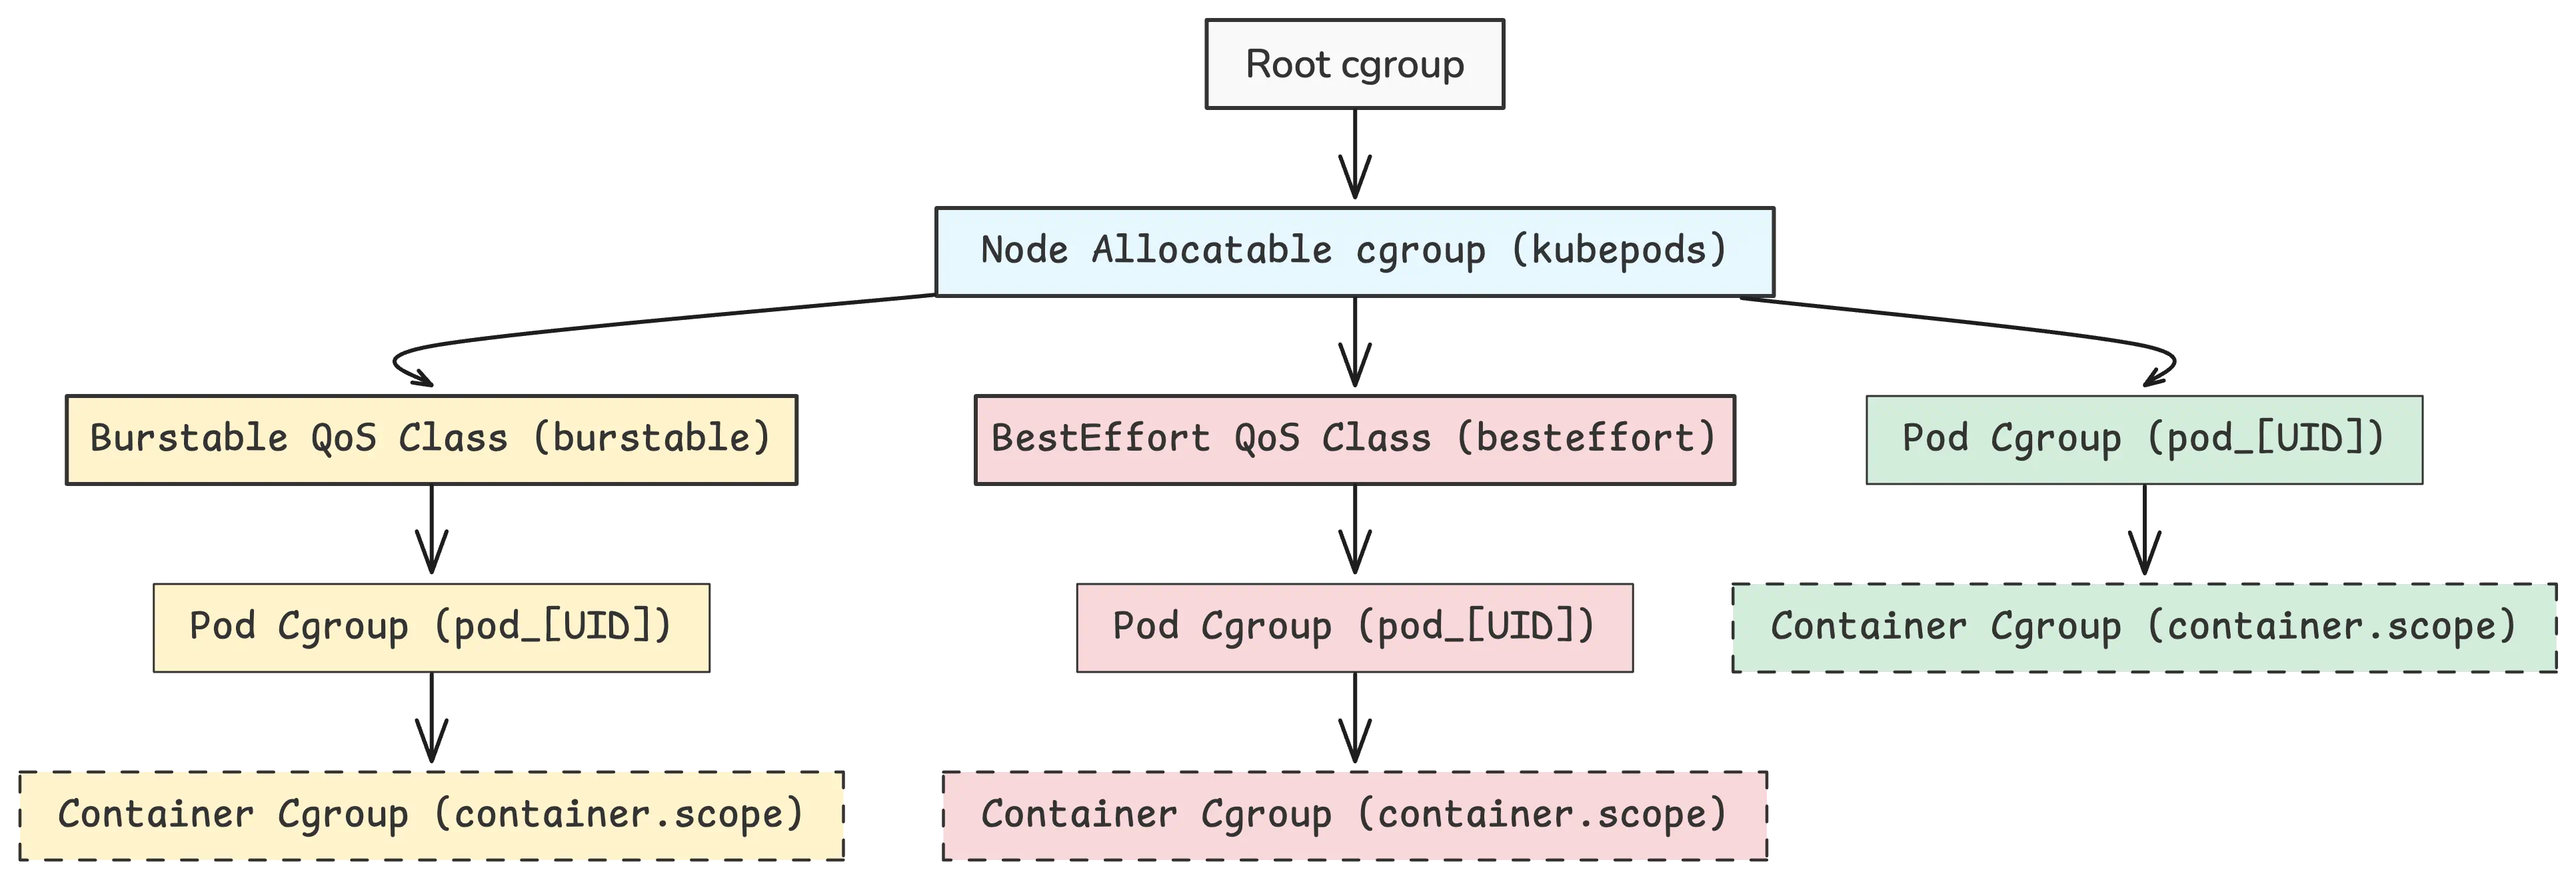
At the top of the structure, there’s the root cgroup. That’s the starting point. From there, Kubernetes (through the kubelet, which is the main agent running on each node) sets up a node-level cgroup, usually named kubepods, to manage all the workloads.
Below that, things are split up by QoS classes (short for Quality of Service). Each pod falls into one of three classes, based on how it defines its CPU and memory requests and limits:
- A Guaranteed pod has CPU and memory requests that are exactly the same as their limits. These get the best performance and priority.
- A Burstable pod has a lower request than limit—so it’s guaranteed a baseline, but it can use more if there’s room.
- A Best-Effort pod doesn’t define any requests or limits. It uses whatever’s left and is the first to get throttled or evicted when things get tight.
Now, here’s something that trips people up: if a pod has equal CPU requests and limits, but its memory requests and limits are not the same, it’s not considered Guaranteed. It misses that second requirement.
So why does it matter? When a node runs low on resources, Kubernetes uses these QoS classes to figure out who gets slowed down or kicked out first. For example, during memory pressure, Best-Effort pods are the first to go, then Burstable, and Guaranteed pods are kept around the longest.
Tip
- Set the memory limit higher than the request for Burstable QoS workloads to allow for fluctuations.
- For critical workloads, set identical memory requests and limits for Guaranteed QoS. We recommend doing this for VictoriaMetrics components such as
vmstorage: Kubernetes Best Practices for VictoriaMetrics
Behind the scenes, the QoS class affects the pod’s OOM score (Out Of Memory score), which influences which processes the Linux kernel kills first when memory’s about to run out.
The lower the OOM score, the less likely the process will be killed:
- Guaranteed containers usually have an OOM score of -997. That’s a very low score, so they’re less likely to be killed.
- Burstable containers get scores between 2 and 1000. The more you request, the lower your score.
- Best-Effort containers end up with the highest score—1000—and are at the top of the list to get killed.
Eviction vs OOM Kill
- Eviction: This is handled by the kubelet. It’s a cleaner process—Kubernetes gives the pod time to shutdown gracefully (unless it’s a hard eviction). You’ll see proper status updates and events in the logs.
- OOM kill: This comes from the Linux kernel when memory runs out fast. It happens at the process level, with no warning, no grace period—just gone.
Once a pod lands on a node, the kubelet sets up a new cgroup for it under the right QoS class. Then, when the container runtime kicks in, it puts the containers in their own cgroups inside the pod’s cgroup.
The resource settings are worked out like this:
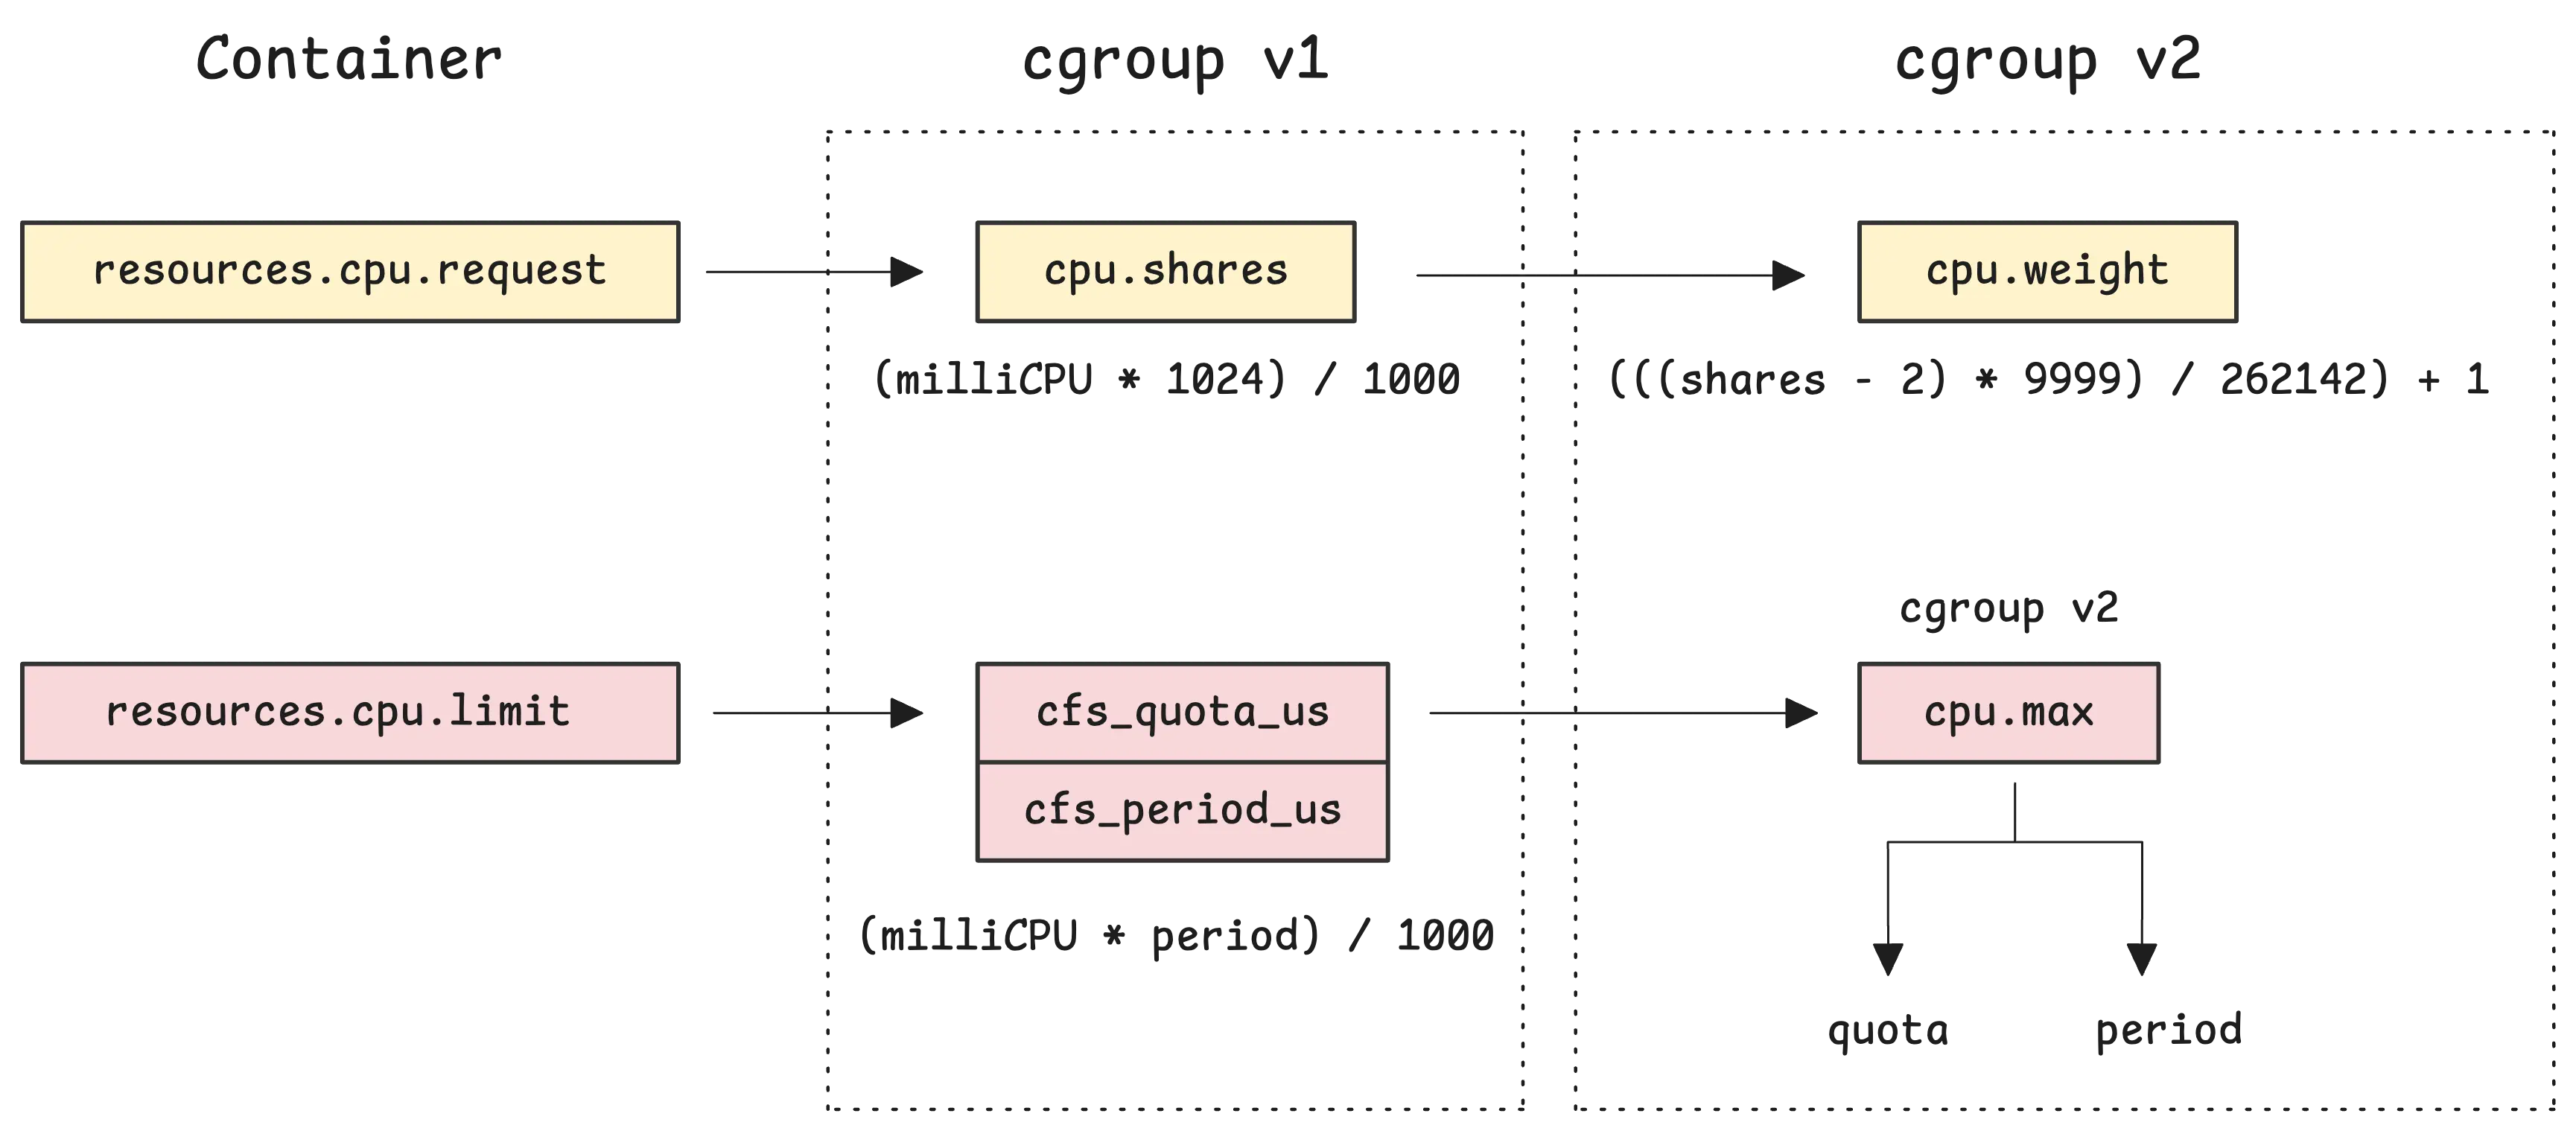
- CPU requests are translated into
cpu.shares(for cgroup v1) orcpu.weight(for cgroup v2) - CPU limits become
cpu.cfs_quota_uswithcpu.cfs_period_us(for v1) or justcpu.max(for v2)
You don’t need to worry about the exact details of how values are converted just yet—that part’s coming up next.
There are 2 things involved here: the Linux kernel and Kubernetes (or any container orchestrator you’re using).
The Linux kernel sets up the cgroups virtual filesystem under
/sys/fs/cgroup. This is basically the interface where processes can configure and control how resources like CPU and memory get allocated. So, the kernel’s the one that creates all those files you might’ve seen—cpu.max,cpu.cfs_quota_us,cpu.cfs_period_us,cpu.shares, and so on.Kubernetes and the container runtime (like containerd or CRI-O) do two main things:
- They create the directory structure under
/sys/fs/cgroup/to organize pods and containers in a way the kernel understands. You’ll get paths like/sys/fs/cgroup/kubepods/pod{UID}/{container-UID}. - Then they take whatever you wrote in your pod spec under
resources.*.cpuandresources.*.memory, translate that into the right format, and write those values into the kernel’s files. For example, Kubernetes might write your CPU limits directly into/sys/fs/cgroup/kubepods/pod{UID}/{container-UID}/cpu.max.
- They create the directory structure under
You can check all this out directly on a node. Just go into /sys/fs/cgroup/ and you’ll find a layout that matches what we’ve been talking about:
/sys/fs/cgroup/kubepods/burstable/pod03ca2395-...-39011eb41a40
├── cpu.max:        max 100000
├── cpu.weight:     4
├── memory.max:     536870912
│
├── /sys/fs/cgroup/kubepods/burstable/pod03ca2395-...-39011eb41a40/098b...2abe
│   ├── cpu.max:        max 100000
│   ├── cpu.weight:     4
│   └── memory.max:     536870912
│
└── /sys/fs/cgroup/kubepods/burstable/pod03ca2395-...-39011eb41a40/984d...8aba
    ├── cpu.max:        max 100000
    ├── cpu.weight:     1
    └── memory.max:     max
Even if your pod has just 1 container, you’ll probably still see 2 directories: one for your container, and another for the pause container. No need to worry about that one—it’s not important for what we’re discussing here.
Now, there’s something called the CPU Manager in Kubernetes, and it supports two policies: none and static. For now, we’ll stick with none, since that’s the default.
What’s this
static policy about?With static, Kubernetes can give certain containers exclusive access to CPU cores. But it only kicks in if the container:
- Is in the Guaranteed QoS class
- Asks for a full number of CPUs (like
1or2, not0.5)
Let’s say you’ve got a latency-sensitive app that needs steady performance. You can run it in a Guaranteed pod that requests 2 CPUs. The CPU Manager would pin that container to 2 dedicated CPU cores. Nothing else would be allowed to run on those cores. That’s really useful for apps that don’t play well with CPU sharing or need strong cache locality.
All the other containers—Burstable, Best-Effort, and Guaranteed ones with fractional CPU requests—share the rest of the cores in the usual way using CFS (Completely Fair Scheduler).
CPU Request
#
The none policy is what Kubernetes uses by default. With this setup, CPU sharing is handled by the Linux kernel’s Completely Fair Scheduler (CFS). What CFS does is split CPU time across running processes—so containers share CPU cores, and the kernel decides who gets how much time and when.
Say you’ve got a 4-core node running multiple containers. Any of those containers can run on any of the cores. The kernel switches them around based on need and fairness.
When you set a CPU request (resources.requests.cpu) in your pod spec, you’re influencing two things:
1. Scheduling behavior
#
This is the minimum amount of CPU that a pod must get in order to be scheduled onto a node.
The Kubernetes scheduler checks the CPU requests of all the pods it’s placing and makes sure a node has enough unreserved CPU capacity for the pod’s request. If it doesn’t, that pod just waits—or it might get scheduled elsewhere.
Let’s say you’ve got a node with 3 cores and you’re trying to place three pods with different CPU requests: A asks for 1.5, B for 1, and C for 1.

In this case, pods A and B can be placed on the node, but C can’t. It’s not because the node is out of CPU power, but because there’s no unallocated requested CPU left. Kubernetes holds that capacity aside to make sure those requests are honored.
2. Runtime behavior during CPU pressure
#
CPU requests matter when multiple pods are pushing the CPU hard. The kernel will still share the CPU, but it also guarantees each pod gets its requested share—even if another pod tries to hog the CPU.
For example, let’s say pod A is using exactly what it requested: 1.5 cores. Pod B is under heavy traffic and wants as much CPU as it can get:

As long as the node isn’t maxed out, pod B can use whatever extra CPU is free—up to its limit, if set. But even if it’s hungry, it won’t interfere with pod A’s fair share. That’s the whole point of CPU requests—they give you a floor.
Now here’s the next thing: What happens if both pod A and pod B want more CPU than they were guaranteed?

In this kind of CPU contention, pods are given CPU time relative to what they requested.
So if Pod A requests 1.5 cores and Pod B requests 1 core, Pod A is weighted more heavily. Specifically, A would receive 60% of the CPU share, and B would receive 40%, based on their relative weights.
That means if there’s 0.5 cores of unused CPU capacity available, A would get 60% of that (0.3 cores), and B would get 40% (0.2 cores).
This ensures that even under heavy load, CPU resources are shared in a fair and predictable way.
CPU Limit
#
The CPU limit (resources.limits.cpu) is used to cap how much CPU time a container can use—even if there’s idle CPU sitting around.
Once a container hits its limit, it gets throttled. That means the kernel forces it to wait for the next scheduling cycle before it can get more CPU time.
This throttling kicks in no matter what the overall load on the system looks like. So even if the node has unused CPU, the container still has to wait. For CPU-heavy workloads, this can lead to slower response times or just generally worse performance.
One important thing here—CPU limits don’t affect scheduling. A pod can still get scheduled on a node even if the total sum of CPU limits for all the containers is more than the node’s actual capacity.
So… should you just avoid using CPU limits altogether?
Note
There’s a solid post by Natan Yelin on this: Stop Using CPU Limits on Kubernetes. The main idea is that when there’s CPU contention, Kubernetes will still guarantee the amount you requested, or the fair share. But if you set a limit, you’re stopping the pod from using any spare CPU—even when it’s available.
Take the earlier example. If pod B is limited to 1 core, it won’t be able to use the extra 0.5 cores available on the node. And if pod A isn’t using its full 1.5, that unused portion just sits there. Pod B can’t grab it, even if it needs it.
However, whether you use a CPU limit depends a lot on the kind of workload you’re running. Some applications actually rely on knowing the CPU limit to make decisions internally.
A few examples—VictoriaMetrics, some Go applications, and JVM-based apps. These sometimes use the CPU limit value to adjust their internal schedulers or runtime behavior. That means the performance of the app can change depending on what that value is.
If you don’t set a CPU limit, the container might assume it has access to the full CPU capacity of the node.
In the Go ecosystem, there’s even an open issue about making GOMAXPROCS more aware of CFS limits when running on Linux: github.com/golang/go/issues/33803
We’ll talk more about how this plays out for Go specifically toward the end of the article.
CPU Weight
#
How CPU Weight Is Calculated
#
When a container runs, it’s basically just a process on a Linux system. The Linux kernel uses the Completely Fair Scheduler (CFS) to determine which process gets to run and for how long. This decision is based on weights, not fixed CPU values.
What’s important to understand is that resources.requests.cpu in Kubernetes spec translates into a weight. It’s the relative weight that matters — not the absolute CPU request. In other words, what matters is how the CPU request of container A compares to that of container B.
For example, if you have 2 containers where:
- A requests
100m - B requests
200m
The kernel sees this the same way as if A requested 1 core and B requested 2 cores or A requested 3 and B requested 6. From the scheduler’s perspective, it’s all about proportion.
The ratio is what counts. If the node is under load, container B will end up getting twice as much CPU time as container A.
In your pod YAML, you’d define it like this:
resources:
  requests:
    cpu: "100m"  # 0.1 cores
Kubernetes then takes this value and converts it into something Linux understands. For cgroup v1, the request becomes a cpu.shares value. That number is clamped between 2 and 262144, using this formula:
cgroup_v1.shares = (milliCPU * 1024) / 1000
cgroup_v1.shares = clamp(cgroup_v1.shares, 2, 262144)
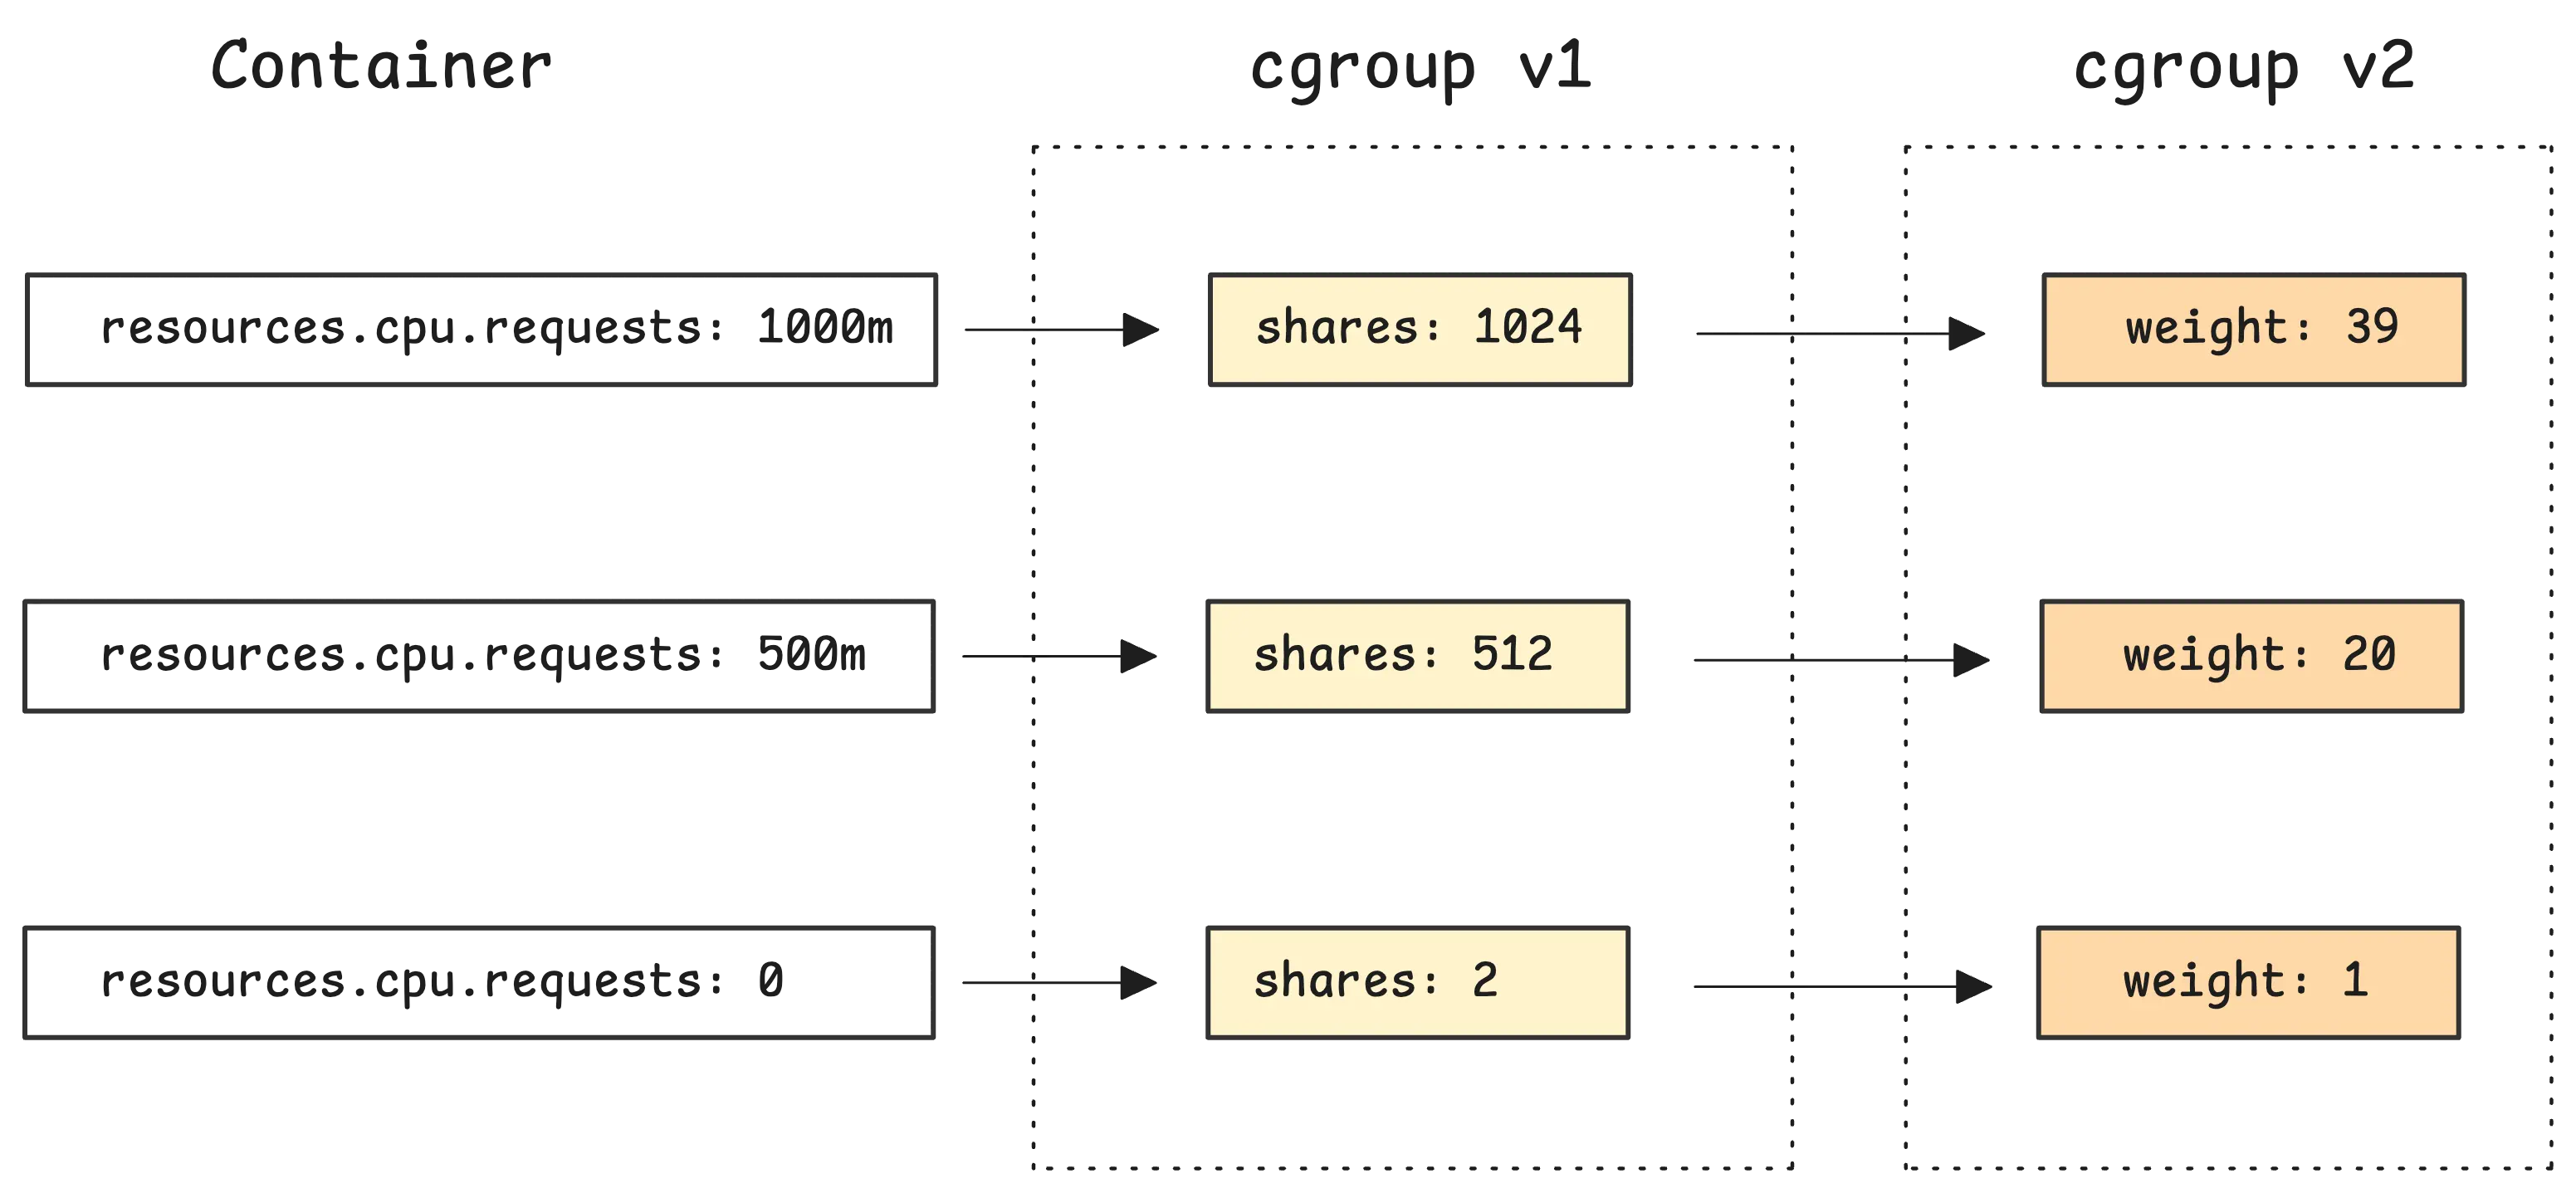
So if you don’t specify a CPU request, or you set it to 0m, Kubernetes gives the container the minimum of 2 shares. On the other end, the most you can cleanly represent this way is about 256 cores (256000m), before it just maxes out.
Then, this shares value gets converted into cpu.weight for cgroup v2:
cgroup_v2.weight = (((cgroup_v1.shares - 2) * 9999) / 262142) + 1
cgroup_v2.weight = clamp(cgroup_v2.weight, 1, 10000)
This maps the full range of possible cgroup v1 shares (2–262144) to cgroup v2 weights (1–10000).
Example results:
At runtime, weight only comes into play when there’s competition for CPU. If your container asks for 100m, and the node has free CPU, it might still get way more—maybe even one or two full cores.
But once other containers start competing for CPU, that weight kicks in. The Linux scheduler uses it to decide how fairly to split CPU time.
If there’s no contention, the only runnable task will just get full CPU access no matter what its weight is. That matches what we discussed in the earlier section.
Note
Kubernetes was built around cgroup v1 in the beginning, using values like cpu.shares. Cgroup v2 later came in and became the default in recent Linux distros. These days, Kubernetes supports both, and maps between them where needed.
Which container gets more CPU time?
#
The weight tells the scheduler how much CPU time that container should get compared to others. So if one container has a weight of 1024 and another has 2048, the second one is expected to get about twice the CPU time when both are busy.
Now, to manage this fairly, the scheduler uses something called virtual time. Every thread keeps track of its own virtual time (vruntime), which is basically how much CPU time it’s gotten—adjusted by its weight.
The scheduler usually picks the process with the lowest vruntime to run next. That way, threads that haven’t had much CPU time get a chance to catch up.
The clever part lies in how vruntime increases at different rates depending on the weight of the task (or thread):
vruntime += actual_runtime * (default_weight / task_weight)
If a thread has a higher weight (task_weight), its vruntime increases more slowly. This makes it appear as though it has been waiting longer, thereby increasing its chances of being selected to run.
Here’s how it breaks down:
- If your thread has the default weight (
1024), virtual time moves forward at the same pace as actual time. - If your thread has a bigger weight like
2048,vruntimeincreases more slowly. - If your thread has a smaller weight like
512, it moves faster in virtual time and gets less CPU during contention.
Let’s put some numbers on it. Say you’ve got 2 threads:
- Thread A with weight
1024 - Thread B with weight
2048
Both are busy and want as much CPU as they can get.
- If A runs for
10ms, itsvruntimeincreases by10ms * (1024 / 1024) = 10ms - If B runs for
10ms, itsvruntimeincreases by10ms * (1024 / 2048) = 5ms
So B’s vruntime stays lower, meaning the scheduler thinks B still hasn’t had its fair share—it keeps letting B run more often. That’s how fairness works here: you get CPU time in proportion to your weight.
Now, if a thread doesn’t need CPU at the moment—maybe it’s sleeping or waiting on I/O—it just gets taken out of the run queue.
When it wakes back up, it’s assigned a new vruntime that reflects the current state of the system. So it doesn’t fall behind too much and can catch up fairly with the rest.
Bottom line—weight only matters when there’s competition. If nobody else is asking for CPU, your container can use as much as it wants, even with a low weight.
CPU Max
#
CPU max is different from CPU weight. While weights only kick in when there’s CPU contention, CPU max is always enforced—no matter how much free CPU the system has.
When you set a CPU limit in your pod spec—like 500m—Kubernetes turns that into a cpu.max value that looks like this: 50000 100000. These two numbers represent the quota and the period, both in microseconds.
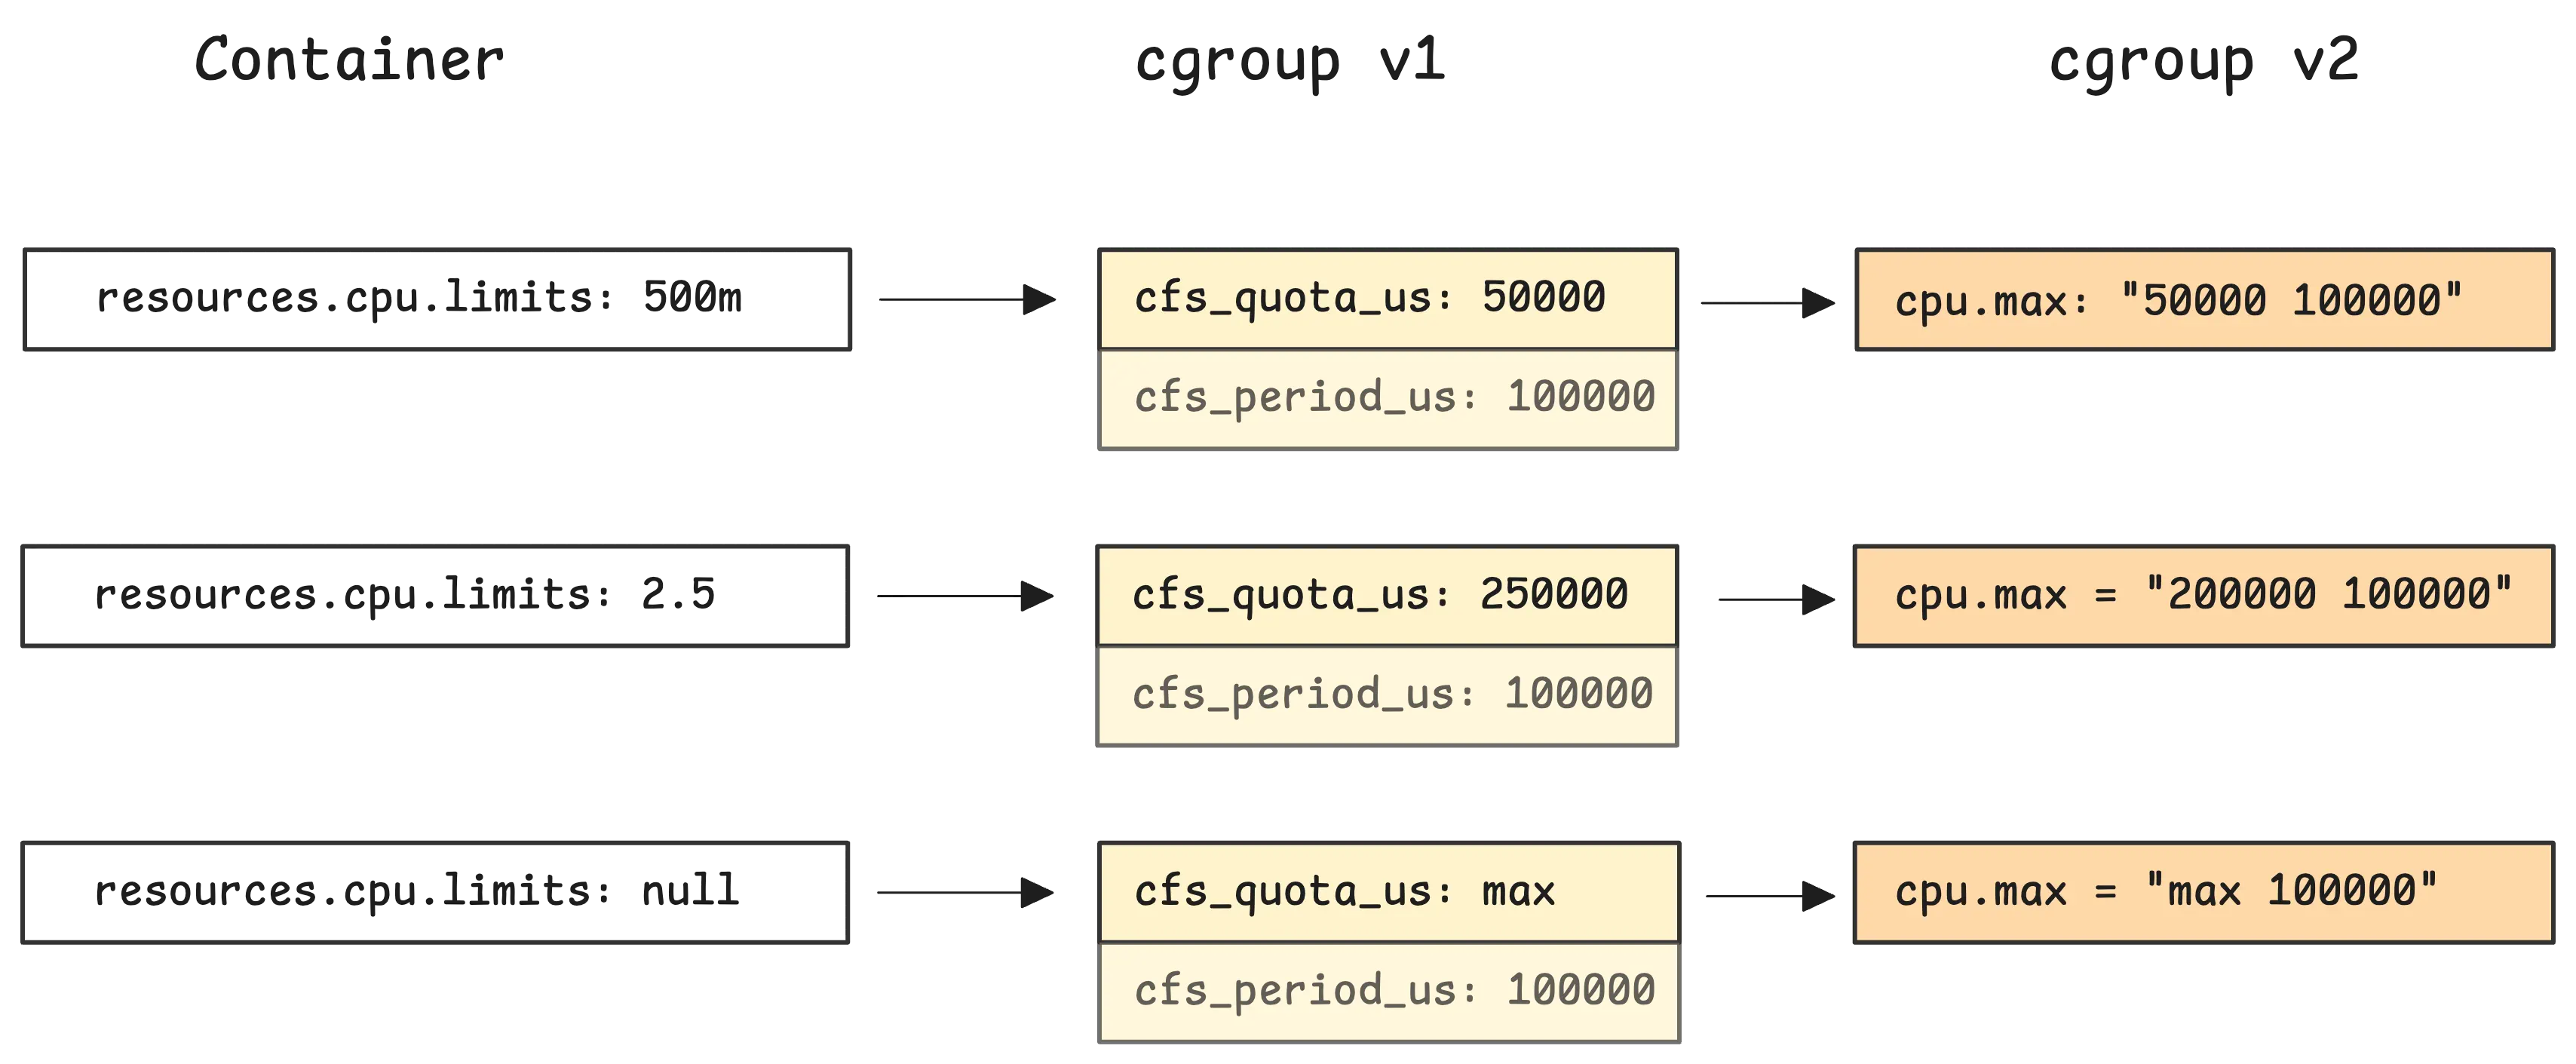
This setup means that over each 100ms window, the container is allowed to use only 50ms of CPU time in total. That works out to 50% of a single core.
Here’s how that calculation looks:
cgroups_v1.cpu_quota = cores * period

// request = 500m
// -> quota = 0.5 * 100000 = 50ms
Question!
“Why is the period 100ms?”
Kubernetes uses a CPU period of 100000 microseconds (100ms) for configuring CPU quotas in Linux cgroups. This value is defined as a constant in the Kubernetes codebase:
// 100000 microseconds is equivalent to 100ms
QuotaPeriod = 100000
This 100ms value matches the default value used by the Linux kernel itself:
/*
 * default period for cfs group bandwidth.
 * default: 0.1s, units: nanoseconds
 */
static inline u64 default_cfs_period(void)
{
	return 100000000ULL;
}
So if your container has a small quota—say, 10ms—it can only use that much CPU time per 100ms period. If it hits the quota early, the kernel puts the container on hold and doesn’t schedule it again until the next period starts. At the start of each new period, the quota resets.
One thing to recall: if there’s no CPU limit set, the container can go ahead and use as much CPU as the node has available. But during CPU pressure, how much time it actually gets will depend on its CPU request compared to other containers.
Now, what if your CPU limit is something like 2.5 cores? That translates to a cpu.max of 250000 100000. So the container is allowed to use 250ms of CPU time every 100ms window.

At first glance, this might look strange—why is the quota bigger than the period?
The limit isn’t tied to just a single CPU. The quota is the total amount of CPU time across all cores. So 250ms means the container can use that much time across however many cores are available.
For example, if your node has 4 cores and your container spawns 4 busy threads, it’s burning 4ms of CPU time for every 1ms of real time. In that case, it’ll hit the 250ms quota after 62.5ms of wall time:
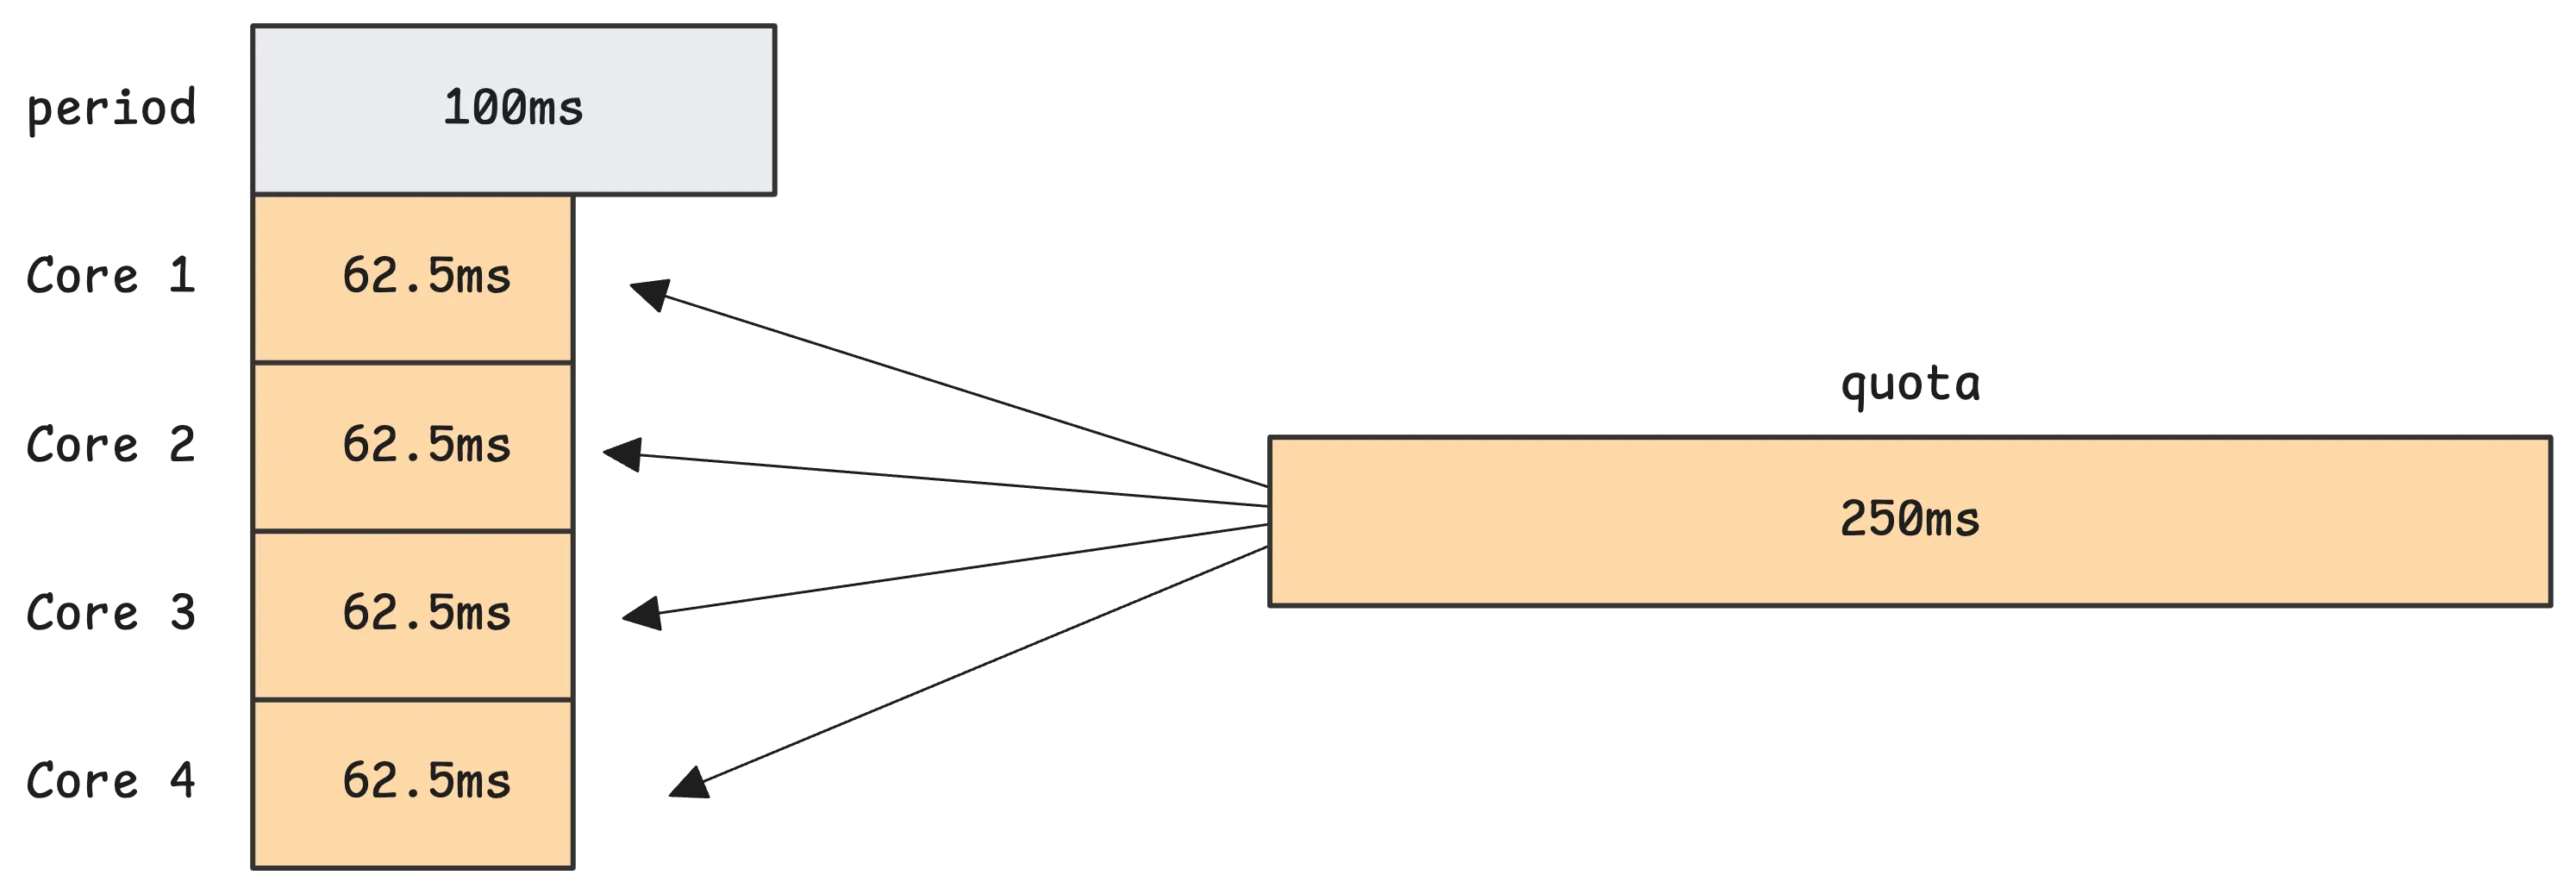
That’s just math. 4 cores × 62.5ms = 250ms. So even though time is moving forward at 1ms per millisecond, the container is consuming 4ms of CPU per millisecond. Once it hits the limit, it gets throttled until the next window starts.
This is assuming the container evenly spreads CPU usage across all cores, but in practice, it doesn’t matter how the 250ms is reached. As long as the total CPU time used across all threads adds up to 250ms, the kernel will throttle the group when it hits that.
GOMAXPROCS
#
In Go, the runtime.NumCPU() returns the number of logical CPUs available to the current process, as determined by the operating system. On the other hand, runtime.GOMAXPROCS(-1) returns the current setting of the maximum number of CPUs that can be executing simultaneously without changing it. The documentation states that GOMAXPROCS “defaults to the value of [runtime.NumCPU]”.
As a result, by default, the Go runtime sets GOMAXPROCS to match the number of CPU cores on the machine:
func main() {
  fmt.Println(runtime.NumCPU())
  fmt.Println(runtime.GOMAXPROCS(-1))
}

// Output:
// 8
// 8
In Kubernetes, that ends up being the total number of cores on the node, not the actual cores available to the container.
So what happens if your container has a CPU limit of 1 core, but it’s running on a node with 8 cores? Now you’ve got a mismatch. You might think using all 8 cores sounds better—more concurrency, right?
Actually, not really.
Here’s what’s going on. The Go runtime sees 8 cores and spins up 8 logical processors to match. But your container only has a budget of 100ms of CPU time every 100ms period, because of the 1-core limit.
Now imagine the runtime schedules all 8 threads at once, and they’re all doing CPU-bound work. The container spreads its CPU time across all 8 cores in parallel. That’s 8 threads using up 100ms total in just 12.5ms of real time (8 × 12.5ms = 100ms)
Once the container hits that 100ms limit, the kernel throttles it. All threads pause until the next period. That can happen really fast.
But if you set GOMAXPROCS=1, the Go runtime only runs one thread at a time. That thread can then use the full 100ms without hitting the quota early.
Question!
“Does this mean the thread is pinned on one core the whole time?”
Not at all. Even with GOMAXPROCS=1, the thread can run on any core. It just won’t run on multiple cores at the same time.
The kernel is free to move it around between CPUs, depending on load, power, or cache considerations. But only one thread is running Go code at a time.
There are a few good reasons why using GOMAXPROCS=1 makes sense in this kind of setup:
- The Linux scheduler avoids moving threads between cores unless it needs to. There’s a cost to migrating, so threads tend to stick to the same core once they’re running.
- Switching between OS threads is relatively expensive. But switching between Go goroutines is really fast. The Go scheduler can pause one goroutine and start another with very little overhead—as long as everything runs on a single thread.
- Garbage collection can suffer if multiple threads get throttled at different times.
That third one’s worth looking into a bit more.
Let’s say your Go app is using 8 OS threads, with GOMAXPROCS=8. At some point, garbage collection starts and needs to stop the world—pause all goroutines briefly. To do that, every Go-managed thread has to hit a safe point and confirm it’s ready
But if one of those threads is currently throttled by the kernel—because you already hit your CPU quota—then it can’t respond to the GC signal. That delays the entire process. The app has to wait for just that thread to get CPU time again before GC can finish.
This is one of the hidden issues that shows up when containers are over-provisioned on threads but under-provisioned on CPU time.
How to set GOMAXPROCS?
#
If you’ve followed along up to this point, you probably have a solid idea of what the uber-go/automaxprocs library does.
It kicks off the moment you import it with a blank import:
import _ "go.uber.org/automaxprocs"
That triggers the package’s init() function. Here’s what it does step-by-step:
- If you’ve already set
GOMAXPROCSmanually, it leaves it alone and uses that. - On Linux, it checks the CPU limits using cgroup values. It supports both cgroup v1 and v2:
- For cgroup v1, it reads from
cpu.cfs_quota_usandcpu.cfs_period_us - For cgroup v2, it reads from
cpu.max
- For cgroup v1, it reads from
- It divides quota by period (
quota / period) to figure out how many logical CPUs are available. We already went through the equation earlier. - It rounds down to the nearest whole number, with a floor of 1.
- So a quota of 2.7 CPUs becomes
GOMAXPROCS=2.
- So a quota of 2.7 CPUs becomes
- Finally, it sets
GOMAXPROCSto the calculated number.
This package is built specifically for Linux—it won’t do anything on platforms like macOS, Windows, or FreeBSD.
Question!
“Where is it reading cpu.cfs_quota_us, cpu.cfs_period_us, or cpu.max from?”
Back near the beginning of this article, we looked at /sys/fs/cgroup—that’s where it all lives on the node. This path is visible inside the container too, not just on the host.
When a container reads from /sys/fs/cgroup, it sees a version of the cgroup tree scoped just to its own cgroup. You can check it yourself:
$ cat /sys/fs/cgroup/cpu.max
max 100000
But yeah, it’s not always that straightforward. Under the hood, the container runtime sets up a new mount namespace, which includes a procfs mount at /proc.
That’s where uber-go/automaxprocs does more of its work. It uses two key files:
/proc/self/cgrouptells you what cgroup the current process is part of. In cgroup v2, this is usually something like0::/./proc/self/mountinfogives detailed info about where cgroup2 is mounted—typically/sys/fs/cgroup.
The library reads these files to find the cgroup path and where the cgroup filesystem is mounted. Then it pulls the quota and period data to calculate available CPU time.
For instance:
- The library reads
/proc/self/cgroupand finds the unified hierarchy entry0::/to figure out which part of the cgroup tree it’s in. - Then it looks at
/proc/self/mountinfoto locate where the cgroup2 filesystem is mounted—usually that’s/sys/fs/cgroup.
Now, could you make your own version of automaxprocs that uses CPU requests instead of limits? Yes, that’s possible. Since CPU requests are available through /sys/fs/cgroup/cpu.weight, and we already know the formula to convert weight into request, it’s totally doable.
You’d read the weight (or the shares for cgroup v1) from this file, reverse the calculation, and then figure out the effective GOMAXPROCS.
Metrics
#
All the core CPU and throttling metrics come from cAdvisor, which runs as part of the Kubelet. You can scrape these metrics into monitoring systems like VictoriaMetrics and start making sense of them there.
CPU Stats
#
Most of what cAdvisor reports is pulled straight from files like /sys/fs/cgroup/../cpu.stat.
$ cat /sys/fs/cgroup/cpu.stat

usage_usec 2618589
user_usec 2102728
system_usec 515861
nr_periods 309
nr_throttled 164
throttled_usec 15383840
nr_bursts 0
burst_usec 0
Here’s how the values map to metrics you’d typically see:
container_cpu_usage_seconds_totalis the total CPU time used across all cores of your container. It comes from theusage_usecfield incpu.stat.container_cpu_user_seconds_totalandcontainer_cpu_system_seconds_totaltrack time spent in user mode and kernel mode, pulled fromuser_usecandsystem_usec.container_cpu_cfs_periods_totaltells you how many 100ms CPU windows have passed. This comes fromnr_periods.container_cpu_cfs_throttled_periods_totalcounts how many of those periods had the container throttled. If your container got throttled during30out of50windows, this would be30. It maps tonr_throttled.container_cpu_cfs_throttled_seconds_totalshows how much total time the container was throttled. If it got paused for30msin each of10periods, this would show300000microseconds (300ms). That’s coming fromthrottled_usec.
If your container doesn’t have a CPU limit set, the fields from nr_periods downward are usually all zero. No limit means no throttling.
Now if you start seeing high throttling ratios—say 10% or more—that usually means the CPU limit is too low for what your container is trying to do. You might not even notice it just by looking at average CPU usage, but the performance impact will be there.
Just a heads-up, cAdvisor doesn’t track nr_bursts or burst_usec. These two fields are tied to the CFS burst feature.
They show how many times the container went over its standard quota by using up any saved CPU time from earlier periods. For example, if your container normally gets 50ms every 100ms, and it has a 20ms burst allowance, it could use 60ms during a heavy load period. That counts as one burst.
CPU Pressure
#
cAdvisor also pulls in CPU pressure data using the cpu.pressure file.
This file comes from Linux’s PSI (Pressure Stall Information) system, which tracks when tasks are delayed or stalled due to resource contention—basically when the CPU is too busy to handle everything right away.
Let’s look at the file:
$ cat /sys/fs/cgroup/cpu.pressure

some avg10=12.02 avg60=15.07 avg300=14.00 total=87546620
full avg10=12.02 avg60=15.06 avg300=13.98 total=87399907
Here’s what each line tells you:
someis the time when at least one task in your container wanted CPU but had to wait. It’s a sign of CPU contention, but things are still moving—just a little delayed.fullis more serious. It’s when every runnable task in the container was stalled. Nothing was making forward progress during that time.- The
avg10,avg60,avg300values show exponentially-weighted moving averages over 10, 60, and 300 seconds. Soavg10=4.23would mean that, over the last 10 seconds, tasks were stalled about 4.23% of the time. totalis the sum of all time (in microseconds) that tasks were stalled since PSI started.
From this, cAdvisor exposes a couple of metrics:
container_pressure_cpu_stalled_seconds_total: total time where all tasks in the container were stalled. This comes from thefull.totalvalue.container_pressure_cpu_waiting_seconds_total: total time where at least some tasks were stalled. This is taken fromsome.total.
These two metrics give you a pretty direct view into how much CPU pressure your containers are dealing with—something that raw CPU usage numbers don’t always show clearly.
And these 2 metrics also wrap up our article. Enjoy!
Who We Are
#
If you want to monitor your services, track metrics, and see how everything performs, you might want to check out VictoriaMetrics. It’s a fast, open-source, and cost-saving way to keep an eye on your infrastructure.
And we’re Gophers, enthusiasts who love researching, experimenting, and sharing knowledge about Go and its ecosystem. If you spot anything that’s outdated or if you have questions, don’t hesitate to reach out. You can drop me a DM on X(@func25).
Related articles:
- Golang Series at VictoriaMetrics
- How Go Arrays Work and Get Tricky with For-Range
- Slices in Go: Grow Big or Go Home
- Go Maps Explained: How Key-Value Pairs Are Actually Stored
- Golang Defer: From Basic To Traps
- Vendoring, or go mod vendor: What is it?
Leave a comment below or Contact Us if you have any questions!
comments powered by Disqus