- Blog /
- Introducing VictoriaStack: The Right Database for Every Signal
Introducing VictoriaStack: The Right Database for Every Signal
Share:


Purpose-built Databases for metrics, logs, and traces, deployed and ingested the same way.
Most teams we talk to run three observability backends: one for metrics, one for logs, and one for traces. Each has its own storage model, scaling behavior, and upgrade cycle, and each needs someone on the team who knows how to keep it alive. The bill grows with telemetry volume, and so does the time engineers spend operating the tools instead of using them.
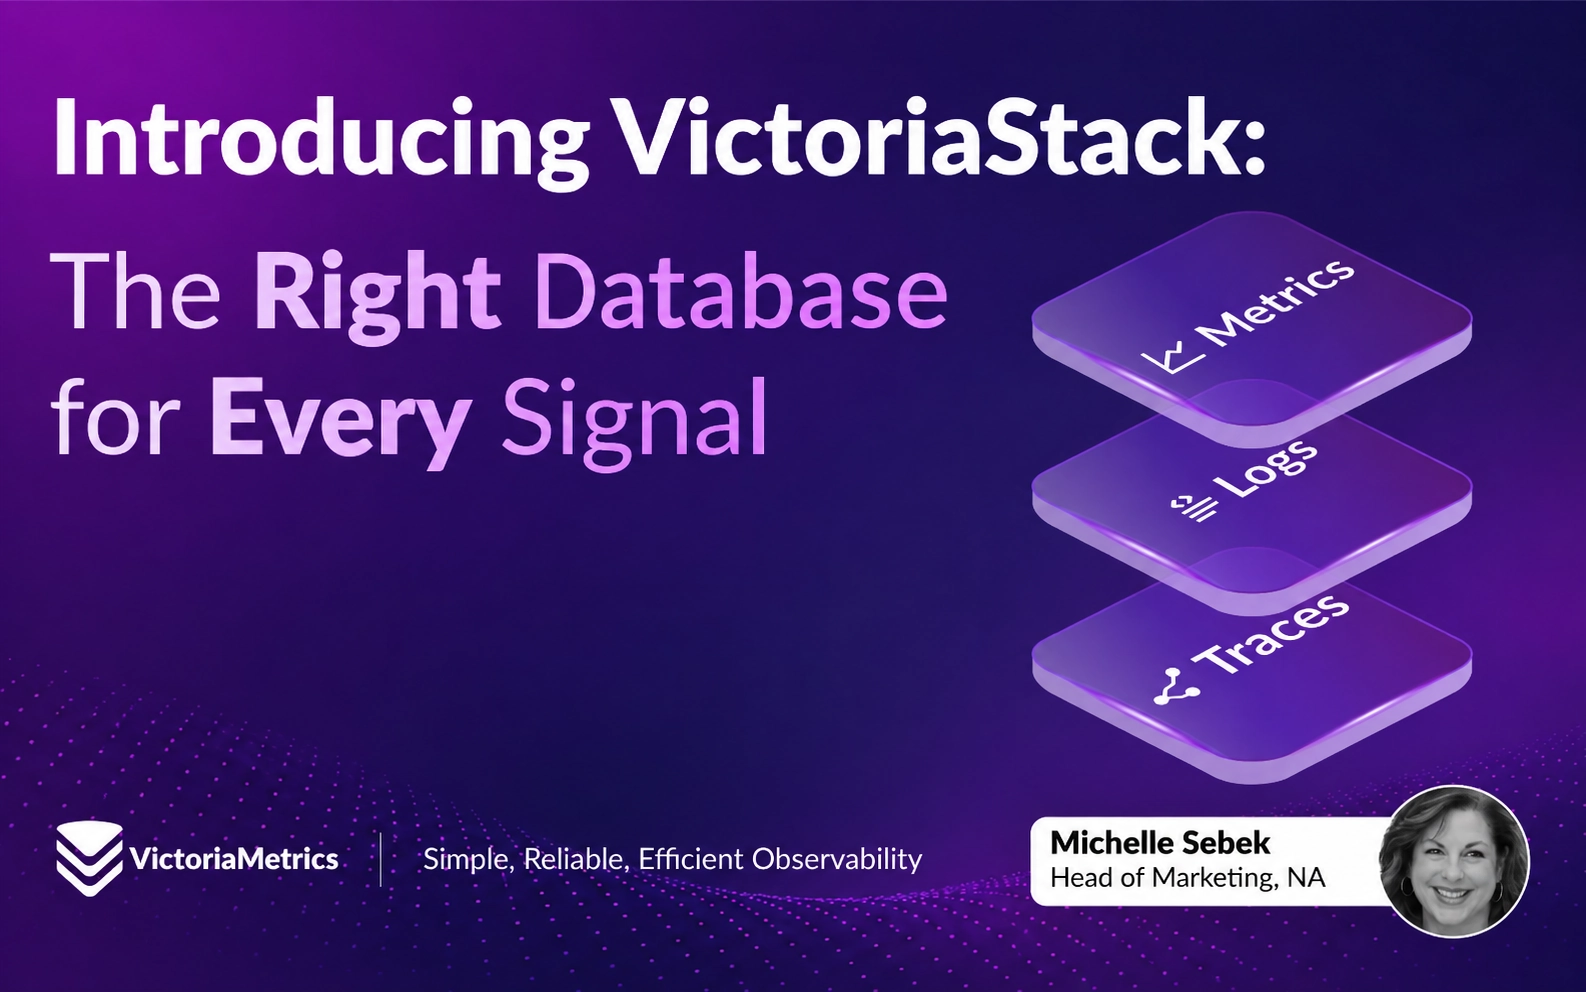
Today we’re introducing VictoriaStack, an open-source observability stack for metrics, logs, and traces. VictoriaStack brings VictoriaMetrics, VictoriaLogs, and VictoriaTraces together as one coordinated stack. Each signal keeps a database built for its workload. The three share the similar design, the same ingestion and querying path, and you can run one of them, two, or all three.
Why each signal gets its own database
#
Metrics, logs, and traces all arrive as timestamped telemetry, which makes a single database for everything sound efficient. Once you try to store and query them, they behave very differently. Metrics are small numeric samples arriving at a steady rate, where the hard problems are high cardinality and label churn from short-lived Kubernetes pods. Logs are large, mostly unstructured text, where the hard problems are ingestion throughput and fast full-text search across weeks of data. Traces are trees of spans spread across services, where the hard problems are heavy write volume and fast retrieval, both by trace ID and by filters like service name and latency.
Putting all three into one general-purpose database means the storage format suits none of them well. You pay for it in memory, disk, and query latency, and you scale the whole deployment to fit whichever signal grows fastest. We took the opposite approach years ago with VictoriaMetrics and kept it as we added logs and traces: each signal gets storage and a query engine designed around how that data is written and read.
That design is why DreamHost, after moving from Prometheus, cut memory usage by 80% while running 76 million active time series. VictoriaStack applies the same design to all three signals.
One stack, three specialized databases
#
VictoriaStack combines three open-source products. VictoriaMetrics has run in production for years at companies including Spotify, Roblox, and Grammarly, while VictoriaLogs and VictoriaTraces are newer with user and customer adoption growing here as well. All three engines fully support OpenTelemetry (OTLP) - see details on ingestion protocols here: VictoriaStack Ingestion Documentation
| Component | Signal | Query language | Ingestion | Query and visualization |
|---|---|---|---|---|
| VictoriaMetrics | Metrics | MetricsQL (PromQL-compatible) | OTLP, Prometheus remote write, InfluxDB, Graphite, OpenTSDB, Datadog agent | Grafana, Perses; vmalert for alerting and recording rules |
| VictoriaLogs | Logs | LogsQL | OTLP, popular log shippers | Grafana, Perses; vmalert for alerting and recording rules |
| VictoriaTraces | Traces | LogsQL | OTLP | Grafana, Perses; vmalert for alerting and recording rules |
VictoriaTraces is built on the VictoriaLogs. It stores spans as structured log entries and lets you query them with LogsQL, so a team already running VictoriaLogs adds tracing without learning a new query language.
All three components deploy on Kubernetes with Helm charts and the VictoriaMetrics Kubernetes Operator, and each scales on its own. If your log volume triples next quarter, you scale VictoriaLogs and leave metrics and traces alone.
One OpenTelemetry pipeline, three destinations
#
If your applications are instrumented with OpenTelemetry, you don’t need a new vendor-specific agent. Keep the OpenTelemetry Collector you already run, or deploy one. Then point its exporters at VictoriaStack over OTLP/HTTP: metrics to VictoriaMetrics, logs to VictoriaLogs, and traces to VictoriaTraces.
Your applications keep sending OTLP to the Collector as they do today, so swapping a backend later is a change to one exporter block, not to your instrumentation. If you already send Prometheus metrics via remote_write or ship logs with an existing agent, those paths keep working for metrics and logs. We document OpenTelemetry first because all three solutions support it.
Investigating incidents with AI agents
#
Some of the teams we work with now start an incident investigation in Claude Code or Cursor before they open a dashboard. An agent is only as useful as the data it can reach. It also fires many exploratory queries in quick succession, which puts real load on the backend.
VictoriaMetrics publishes official MCP servers for VictoriaMetrics, VictoriaLogs, and VictoriaTraces. They’re separate open-source projects that you install alongside the stack, using any of the deployment methods on the AI tools page. Once you connect them to Claude Code, Cursor, or your own in-house agent, the agent can follow an incident from a latency spike in metrics to the affected service’s error logs, then to the slow spans in the trace. Agent skills, installed the same way, add ready-made workflows for these multi-signal investigations.
The MCP servers for all three signals query through read-only APIs. Agents query, explain, and propose, and engineers decide what gets applied. Query speed matters here as well: an investigation that takes 20 agent queries stays interactive only if each one returns quickly.
Start with one signal
#
You don’t have to adopt VictoriaStack all at once. Most teams start with whichever signal costs them the most today. For many, that is a Prometheus, Thanos, or Mimir setup that has outgrown its memory budget; for others, it is a logging bill that keeps climbing. Run that component for a while, then add the next one when it earns its place. No VictoriaStack component requires the other two to be present.
VictoriaMetrics, VictoriaLogs, and VictoriaTraces are open source, and you can read, run, and contribute to all three without talking to us. Teams that want commercial support, long-term support releases, and additional capabilities can run VictoriaMetrics and VictoriaLogs with VictoriaMetrics Enterprise on their own infrastructure. Teams that would rather not operate the backend at all can use VictoriaMetrics Cloud, where we handle provisioning, upgrades, monitoring, and backups. Pick the operating model that fits your team.
The VictoriaStack code is on GitHub, Quick Start, and the deployment documentation covers installing each solution on Kubernetes or bare metal. Questions, bug reports, and pull requests are welcome, as they have been since the first VictoriaMetrics release.
By engineers, for engineers.
Leave a comment below or Contact Us if you have any questions!
comments powered by Disqus
You might also like:
VictoriaMetrics 2026 Mid Year Roundup
Take a look at what we shipped in the first half of 2026 across VictoriaMetrics: metrics, logs, traces, and cloud,with improvements in performance, scalability, and usability.
VictoriaMetrics January 2026 Ecosystem Updates
January 2026 updates deliver quality of life improvements, performance optimizations, and tighter Kubernetes integration across the VictoriaMetrics Observability Stack.
Our latest updates across the VictoriaMetrics Observability ecosystem
The VictoriaMetrics ecosystem continues to evolve rapidly, and the latest updates bring meaningful improvements across metrics, logs, and traces. Read the announcement for details.