- Blog /
- Integrations made easy with VictoriaMetrics Cloud

Integrations made easy with VictoriaMetrics Cloud
Share:


VictoriaMetrics Cloud continues to evolve as the most efficient, scalable and open platform in the observability landscape. In our last Q1 update blogpost, we shared new features such as seamless OpenTelemetry integrations, new Organizations support, and improvements in the Explore UI and APIs.
This time we wanted to take a minute to showcase how we’re taking the interoperability journey very seriously.
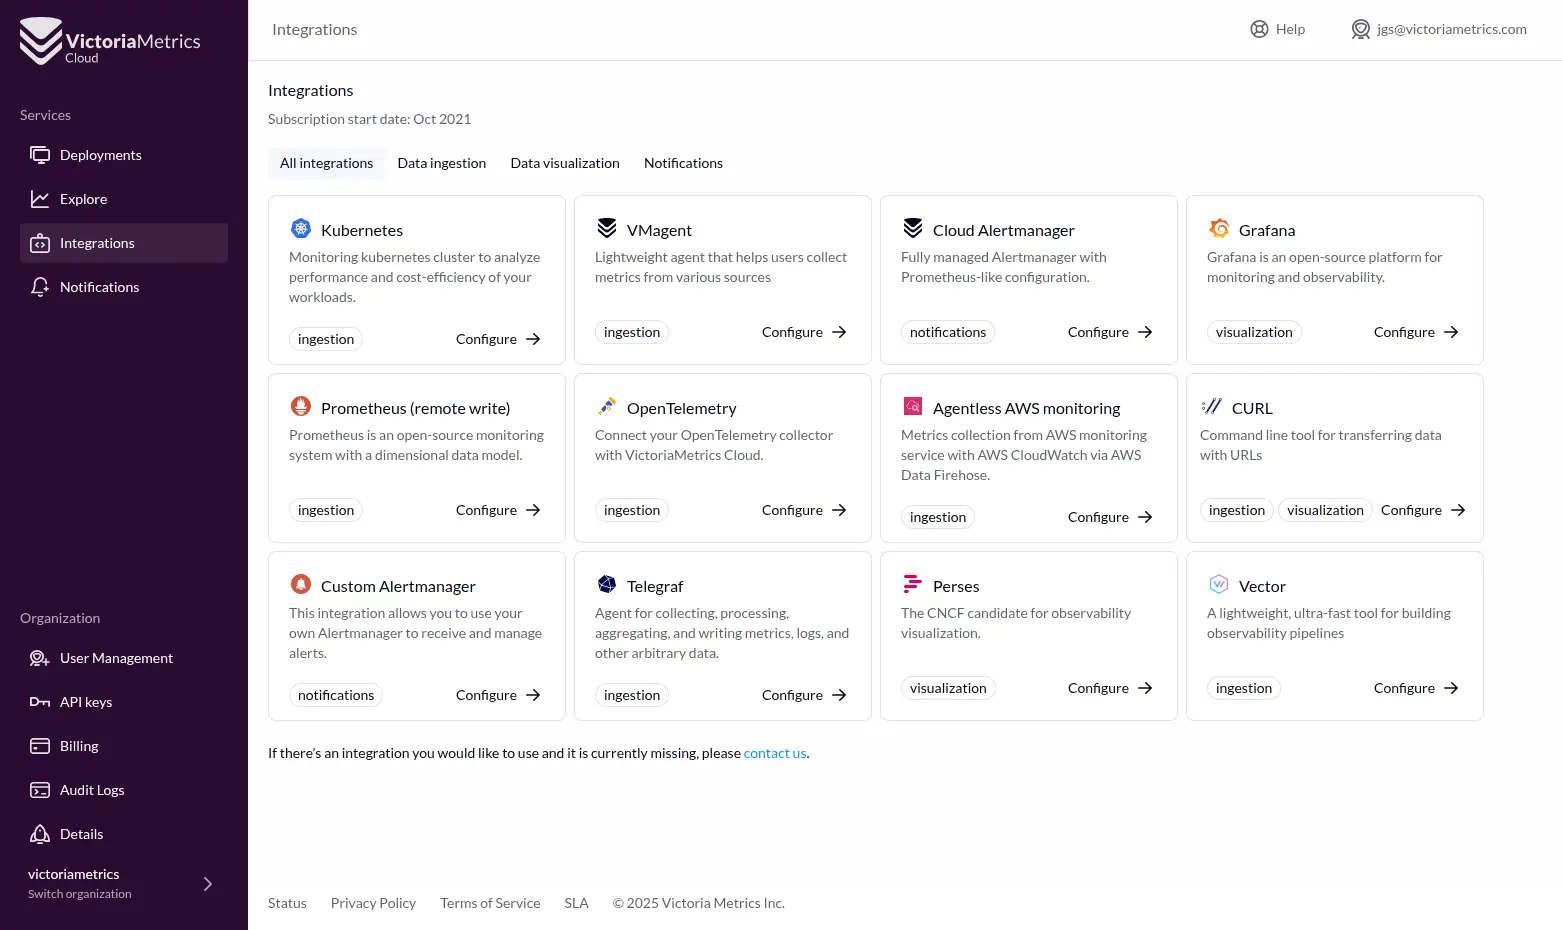 Integrations in VictoriaMetrics Cloud
Haven’t tried VictoriaMetrics Cloud yet?
Sign up for free — no credit card required — and get $200 in credits for one month.
Integrations in VictoriaMetrics Cloud
#
VictoriaMetrics has always focused on openness and interoperability. Whether you’re collecting data from Prometheus, OpenTelemetry, Graphite, or pushing metrics through any observability stack — we don’t force any tools on you. This unopinionated approach truly ensures you avoid vendor lock-in and fit VictoriaMetrics into your existing workflows.
The newly published integrations documentation demonstrates just how easy it is to integrate your systems. Once you select a deployment, all the instructions — from sending metrics to visualizing them — are generated for you with the correct URL and token.
Integrating with VictoriaMetrics Cloud
To get started, all you need is a URL and an Access Token.
Integrate With Everything
#
All integrations come with interactive, step-by-step guides available in the VictoriaMetrics Cloud Console, tailored for your real deployments. This includes copy-paste-ready snippets with all required settings in place.
You can check it out directly in our revamped integrations documentation and experience how, with a couple of clicks in the VictoriaMetrics Cloud Console you can get started with real-world integration snippets customized for your deployments.
VictoriaMetrics Cloud supports integration across the entire observability lifecycle:
Ingestion
#
- CloudWatch - Agentless AWS monitoring integration allows to forward metrics from AWS services (like EC2, RDS, Lambda, etc.) to VictoriaMetrics Cloud without deploying extra collectors or agents.
- CURL can be used to interact with VictoriaMetrics Cloud for pushing metrics using HTTP API endpoints.
- Kubernetes: collect metrics from cluster, nodes, and workloads, and forward them to VictoriaMetrics Cloud using vmagent.
- OpenTelemetry Collector (using either the Helm chart or the Operator) to collect, process, and forward observability data from a wide variety of sources into VictoriaMetrics Cloud.
- Prometheus (remote write), allows forwarding metrics collected by Prometheus to VictoriaMetrics Cloud for long-term storage and advanced querying.
- Telegraf integration is ideal for environments where Telegraf is already used to gather system, application, or custom metrics.
- If you are using Vector, this integration is useful to route metrics to VictoriaMetrics Cloud for storage and analysis.
- vmagent is a lightweight agent designed to collect metrics from various sources, apply relabeling and filtering rules, and forward the data to storage systems. It supports both the Prometheus remote_write protocol and the VictoriaMetrics remote_write protocol for sending data. This makes vmagent ideal for centralized metric collection and forwarding in a resource-efficient way.
Visualization
#
- VictoriaMetrics Cloud can easily be added as a datasource to Grafana, via the built-in Prometheus or VictoriaMetrics datasources. This integration allows you to build powerful, customizable dashboards and monitor your systems in real time using VictoriaMetrics as the backend.
- Perses: VictoriaMetrics Cloud can be used as a data source in Perses via the Prometheus-compatible query API, allowing you to create dashboards and monitor time series data with a modern and lightweight interface.
- CURL, can also be used for querying stored data using HTTP API endpoints. This makes it a simple and flexible option for testing or basic integrations.
Alerts & Notifications
#
- Cloud AlertManager: VictoriaMetrics Cloud comes with a fully managed AlertManager based on vmalert, which can be used to send notifications. This integration provides a seamless way to trigger alerts based on Prometheus-compatible queries and route them to your preferred notification channels, such as email, PagerDuty, Slack, MS Teams or webhooks.
- If you already have a Custom AlertManager VictoriaMetrics Cloud allows you to define and manage alerting rules using to your instance. This integration provides full flexibility for organizations that already operate their own AlertManager setup and want to connect it to VictoriaMetrics Cloud’s alerting engine.
Example: Integrate Kubernetes with VictoriaMetrics Kubernetes Stack
#
As already mentioned, if you are curious about how easy it is to integrate with VictoriaMetrics Cloud, we encourage you to visit our docs to experience by yourself. However, here’s a brief example of what it takes for one of the most used integrations: Monitoring Kubernetes via the VictoriaMetrics Kubernetes Stack: a Helm chart that brings together all the key components to collect and push metrics to VictoriaMetrics Cloud if you are starting from zero.
This stack includes:
- vmagent to collect and forward metrics.
- Prebuilt dashboards and alerts to get started quickly in observability.
- Easy setup using just your
<DEPLOYMENT_ENDPOINT_URL>and<YOUR_ACCESS_TOKEN>.
 Integrating Kubernetes with VictoriaMetrics Cloud
Three steps to observe:
#
- Create a Secret with your VictoriaMetrics Cloud Access Token:
kubectl create secret generic vmauth-creds \
  --from-literal=VMAUTH_TOKEN='<YOUR_ACCESS_TOKEN>'
- Update the
values.yamlwith your endpoint and credentials:
vmagent:
  remoteWrite:
    - url: https://<DEPLOYMENT_ENDPOINT_URL>/api/v1/write
      headers:
        Authorization: "Bearer $VMAUTH_TOKEN"
- Install the Helm chart:
helm repo add victoria-metrics https://victoriametrics.github.io/helm-charts/
helm upgrade --install vm-stack victoria-metrics/victoria-metrics-k8s-stack \
  -f values.yaml
How do I pick endpoint and Access Token?
Both the endpoint and Access Token are already filled for you in VictoriaMetrics Cloud at the interactive Kubernetes integration guide.
After that, your cluster metrics will be flowing into VictoriaMetrics Cloud, with dashboards and alerts ready to go!
Many Ways to Adapt to Your Needs
#
But this is not the only way to ingest Kubernetes metrics! As highlighted in our Q1 blog post, VictoriaMetrics is fully committed to OpenTelemetry as a first-class citizen in our observability stack.
You can monitor your Kubernetes cluster using OpenTelemetry as well, either via the Helm chart or the OpenTelemetry Operator. Explore our OpenTelemetry integration docs or try the guided setup in the Cloud Console.
 Integrating Kubernetes using OpenTelemetry with VictoriaMetrics Cloud
Last reminder (promised!): as every integration with VictoriaMetrics Cloud, you’ll only need a URL and an Access Token to connect your data source or visualization tool — no guesswork needed!
Help Us Improve
#
We’re always looking to make VictoriaMetrics Cloud better. Please take a moment to fill out our quick survey and share your feedback.
Thanks for being part of our community! We hope these improvements make your integration journey smoother than ever. As always, sign up to try everything for free with $200 credits — no credit card required.
Leave a comment below or Contact Us if you have any questions!
comments powered by Disqus