- Blog /
- How Airbnb Built a High-Volume Metrics Pipeline with OpenTelemetry and vmagent

How Airbnb Built a High-Volume Metrics Pipeline with OpenTelemetry and vmagent
Share:


Summary: Let’s look at Airbnb’s migration from a legacy metrics setup to a modern observability pipeline built around OpenTelemetry, OTLP, OpenTelemetry Collector, and vmagent. The article explains how Airbnb handled massive pipeline metrics volume, reduced high-cardinality data before storage, and used streaming aggregation to make OpenTelemetry metrics easier to scale. It also covers the role of telemetry pipelines in routing, transforming, and aggregating metrics efficiently, showing how vmagent can help teams process high-volume observability data without overwhelming their backend systems.
We always knew that Airbnb’s engineering is operating on a completely different scale, and their new high-volume metrics pipeline is proof of that. This is one of those rare stories where scale and efficiency go hand in hand - they modernized their observability stack with open source components and reduced cost by an order of magnitude. Airbnb is now processing more than 100 million samples per second on a single production cluster.
At a large enough scale, observability becomes a systems design problem worth studying. In this post, we’ll walk through how Airbnb got there, why aggregation was essential, and how vmagent ended up as the piece that completed the puzzle.
From StatsD to OpenTelemetry
#
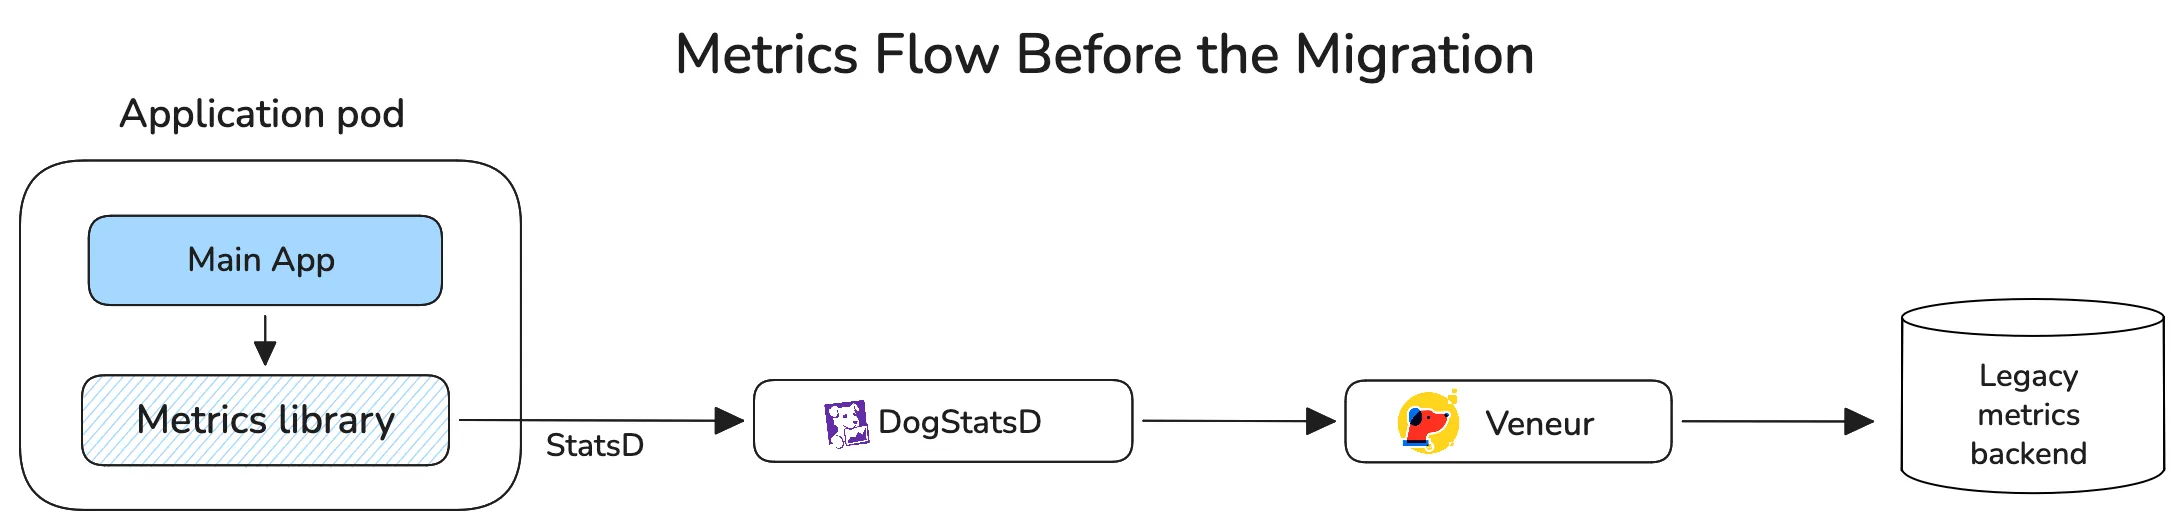
Airbnb’s previous metrics stack was built around StatsD libraries in the application layer, a proprietary Veneur fork in the middle, and a vendor backend at the end of the pipeline. The team had already built custom aggregation behavior into their Veneur fork to keep metrics volume and cardinality under control.
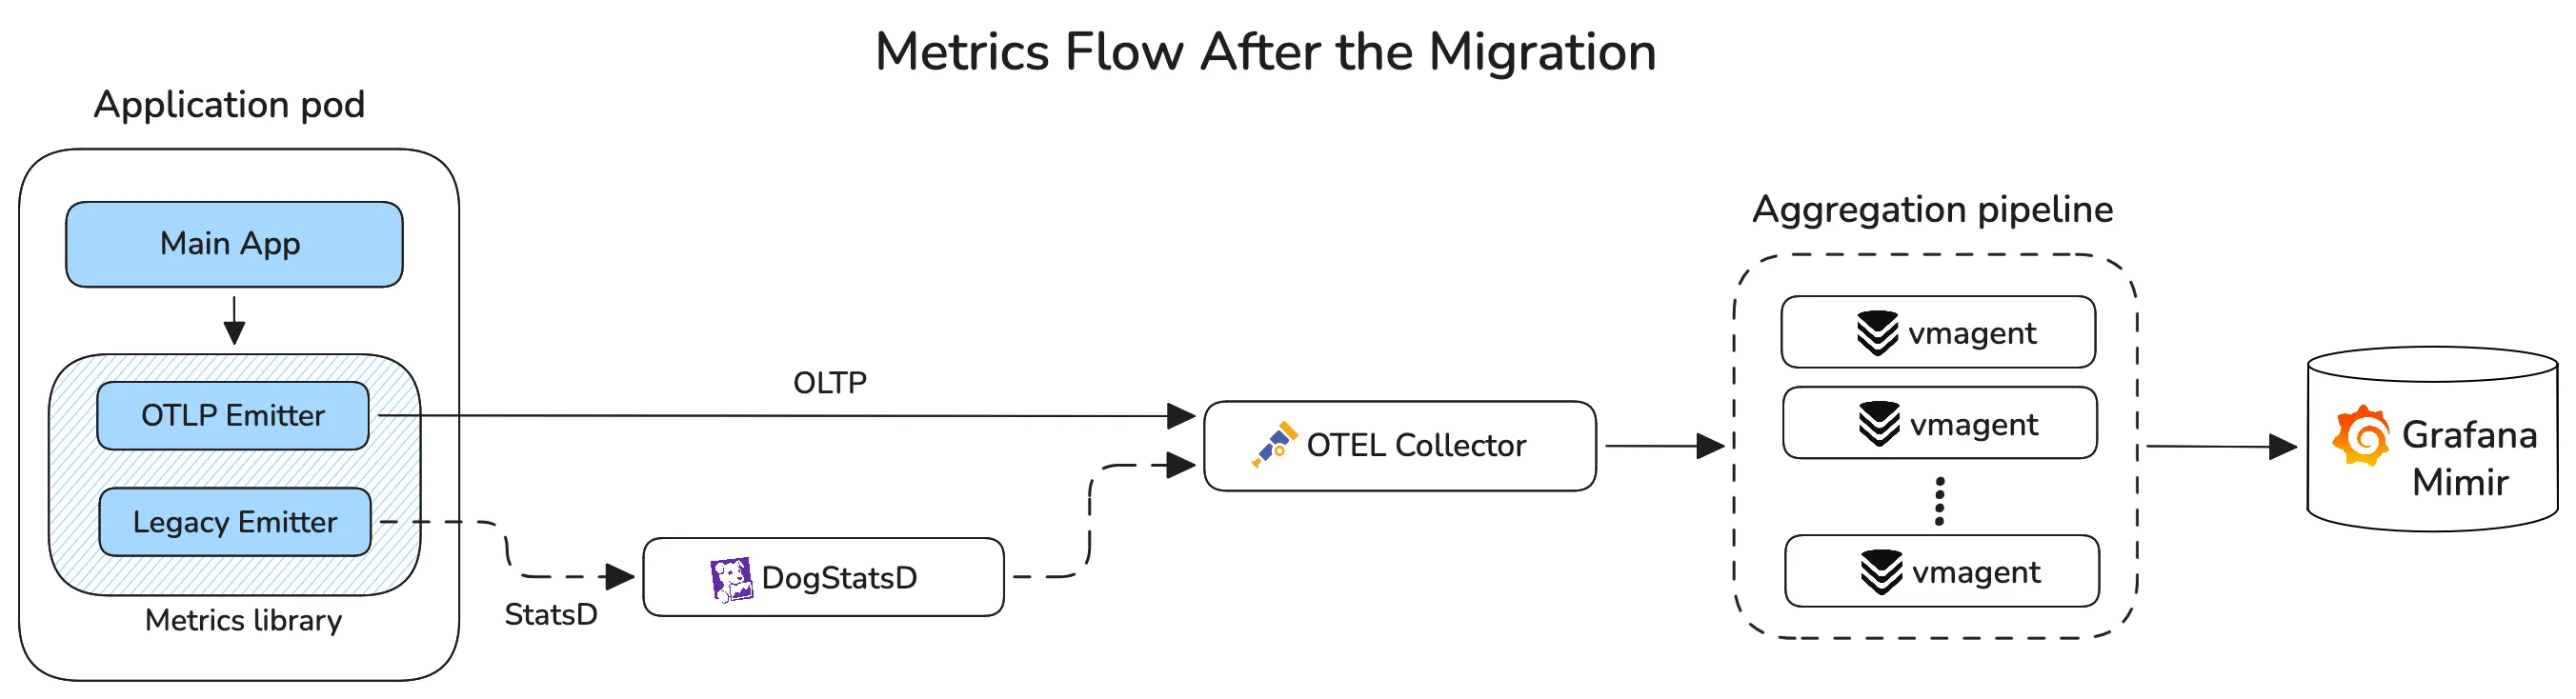
Airbnb’s team wanted to switch to the OpenTelemetry Protocol (OTLP) because it is CNCF-sponsored, open source, and vendor-neutral; it aligns perfectly with their new Prometheus-based storage and open standards. The migration was done in phases, front-loading collection and focusing first on getting all the metrics flowing into the new pipeline to reveal bottlenecks.
A dual-emitter setup was implemented, with StatsD for legacy systems and the OpenTelemetry Collector as the new paved path, followed by the aggregation pipeline, allowing Airbnb to migrate with minimal friction and validate the solution.
Replacing Veneur with vmagent
#
Aggregation before storage was central to Airbnb’s observability stack. Without it, instance labels such as instance and hostname would overload their backend. They had been relying on a privately maintained fork of Veneur to aggregate the less relevant labels.
How to best aggregate metrics in the new observability stack? Various open source options were analyzed and rejected:
- Maintaining Veneur was already an ongoing burden, which would only get worse as they would have to rewrite it to support Prometheus’ protocol and data model.
- Prometheus recording rules were another option, but it defeated the purpose since rules generally require raw series to be ingested first, something Airbnb already decided against.
- Vector and m3aggregator came up too, but both options were seen as too complex for their use case.
In the end, Airbnb chose VictoriaMetrics’ vmagent. As the team put it:
vmagent supports streaming aggregation for Prometheus metrics. It supports sharding, enabling horizontal scaling. Documentation is extremely user-friendly and easy to set up. It has a small codebase (~10K LOC), so it’s easy to understand and modify if needed.
What Is Streaming Aggregation?
#
Streaming aggregation processes incoming samples as they move through the pipeline. Instead of writing every raw time series to storage, it keeps a small in-memory state for each aggregation rule, updates that state as new samples arrive, and flushes the aggregated result to the backend at the end of a configured interval.
Streaming aggregation exists because high cardinality is expensive in terms of storage, memory, and CPU. With streaming aggregation, we deliberately accept lower fidelity by stripping less important labels while preserving the main signal. For example, if we aggregate a counter without: [instance], vmagent can combine samples so that the instance label is removed, while preserving the values in aggregated form.
Unlike relabeling, which can also drop labels or entire series, aggregation can aggregate multiple input series into a single meaningful output series.
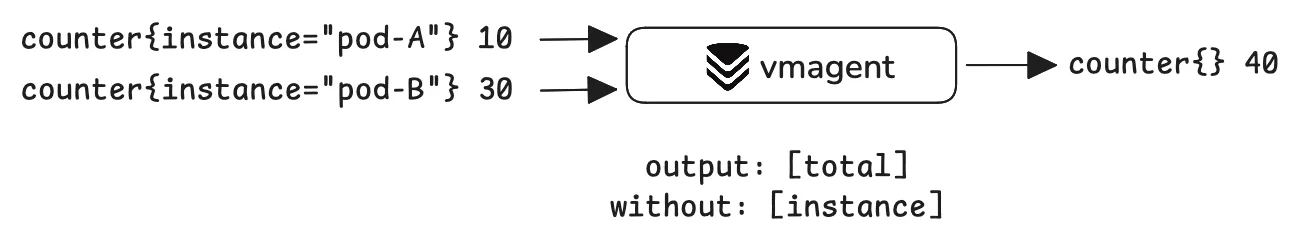
The trade-off is that we can no longer run granular queries like “all requests served per instance” or “how many requests has instance pod-A served?”. However, we can still answer higher-level questions such as “how many requests were served in total?”. In other words, we lose per-instance visibility, but keep the total request count, which is often the information that matters most.
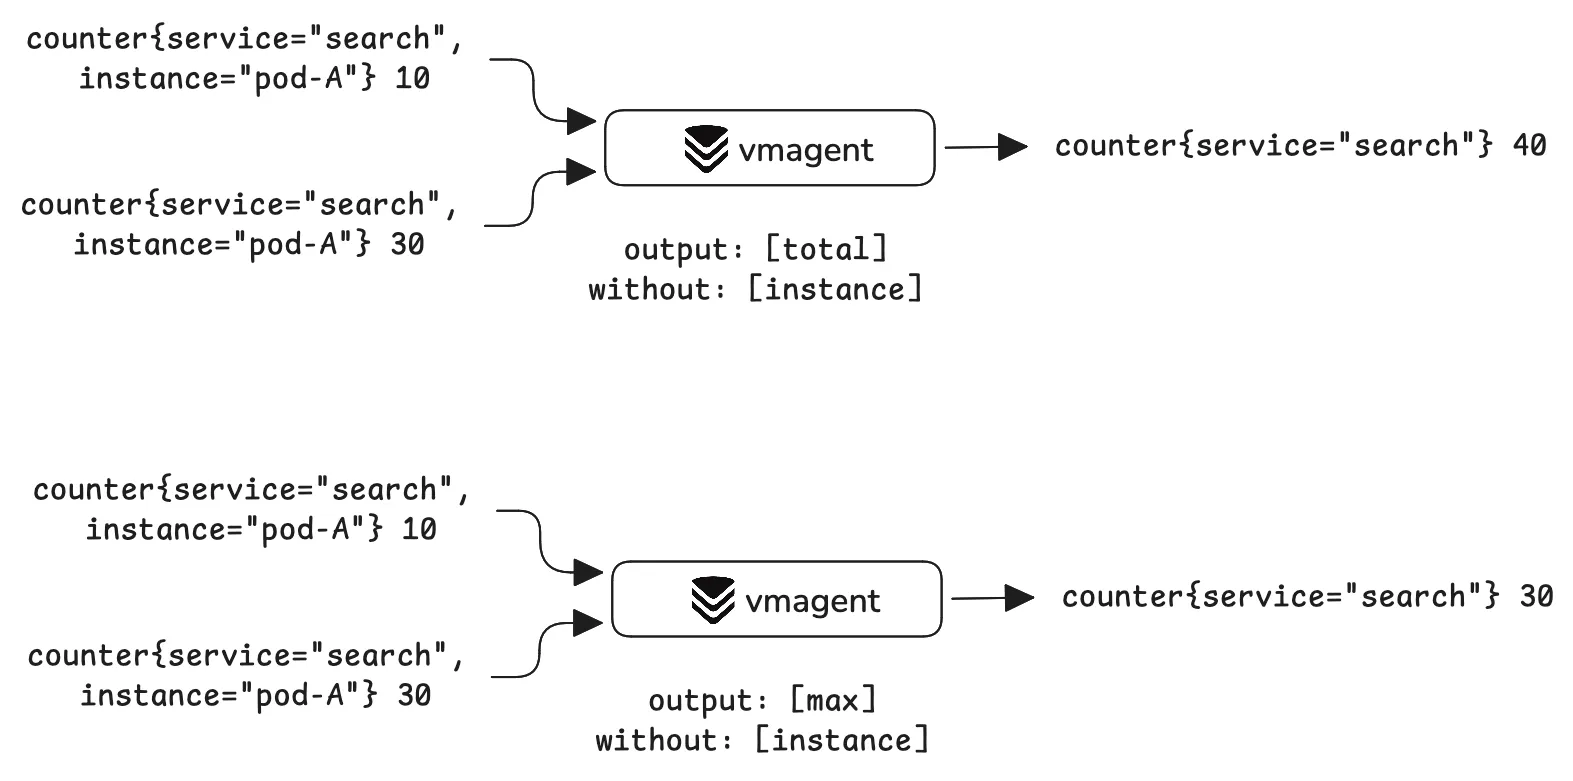
We have several options to aggregate data. Streaming aggregation supports many output functions, so we can control how samples are combined depending on the metric and the result you want to keep.
Streaming aggregation is supported by single-node VictoriaMetrics and vmagent. In vmagent, it is enabled with the -streamAggr.config command-line flag, which should point to a stream aggregation configuration file.
Airbnb’s Aggregation Pipeline
#
Airbnb split its aggregation pipeline into two vmagent layers. The first layer consists of stateless routers that shard by all labels except those being aggregated away. The second layer consists of stateful aggregators that track and aggregate observed series.

Let’s say two samples enter the aggregation pipeline:
counter{service="search", region="us-east-1", host="node-7", instance="pod-a"} 10counter{service="search", region="us-east-1", host="node-1", instance="pod-f"} 12
In this example, service and region are the labels they want to keep, because they describe useful dimensions, and instance and host can be aggregated away to reduce cardinality.
The sharding vmagent is configured with -remoteWrite.shardByURL.ignoreLabels=instance,host to exclude the instance and host labels from the sharding key. This guarantees that metrics with the same service and region are consistently routed to the same aggregator, ensuring correct results.
The idea of ignoring specific labels during sharding was a proposal from Eugene Ma (#5938) while he was working on the new Airbnb pipeline.
Once aggregated, the pipeline outputs the total value as a single time series:
counter{service="search", region="us-east-1"} 22
Airbnb needed to implement a few customizations into vmagent to make it work within the aggregation pipeline. You can learn more about these changes in these blog posts:
- The Airbnb Tech Blog: Building a high-volume metrics pipeline with OpenTelemetry and vmagent
- InfoQ: Airbnb Migrates High-Volume Metrics Pipeline to OpenTelemetry
The interesting part is that these changes were straightforward to implement because vmagent is small, simple, and easy to reason about. With their vmagent fork, Airbnb achieved its goal of aggregating metrics using a single production cluster. They scaled vmagent hundreds of aggregator pods, ingesting over 100 million samples per second.
Closing thoughts
#
What Airbnb built is a reminder that the right middle layer can change everything. vmagent was chosen not for being the flashiest option, but for being open source, simple, reliable, efficient, and best suited to their situation. For us at VictoriaMetrics, it was thrilling to learn that vmagent could play such an important part in helping Airbnb move from a vendor-centric observability setup to an open, modern platform built for scale.
A huge thank you to Eugene Ma, Senior Software Engineer at Airbnb, for their contributions and for sharing the details of their observability stack migration.
Frequently Asked Questions
#
What is OTLP?
#
OTLP, or the OpenTelemetry Protocol, is the standard protocol used by OpenTelemetry to transmit telemetry data between collectors, services, and backends. Airbnb adopted OTLP as part of its migration toward an open, vendor-neutral observability pipeline, helping the team move away from a more proprietary metrics collection path.
How did Airbnb use the OpenTelemetry Collector?
#
Airbnb used the OpenTelemetry Collector as the new paved path for metrics collection while maintaining a dual-emitter setup during migration. This allowed legacy StatsD systems to continue operating while new OpenTelemetry metrics flowed through the updated pipeline, helping Airbnb validate the new architecture with less friction.
What are pipeline metrics?
#
Pipeline metrics are metrics that move through a collection, routing, aggregation, and storage pipeline before reaching the backend. In Airbnb’s case, pipeline metrics had to be processed at very high volume, so aggregation before storage was essential. Without aggregation, labels such as instance and hostname could have created too much cardinality and overloaded the backend.
How does vmagent help with high-volume telemetry pipelines?
#
At VictoriaMetrics, we built vmagent to support efficient metrics collection, routing, and processing. In Airbnb’s high-volume telemetry pipeline, vmagent was used for streaming aggregation, which processes samples as they move through the pipeline. This allows teams to reduce cardinality before storage while preserving the most useful aggregated signals.
Why is streaming aggregation important for OpenTelemetry metrics at scale?
#
Streaming aggregation is important for OpenTelemetry metrics at scale because high-cardinality labels can quickly increase storage, memory, and CPU usage. With vmagent, less important labels can be aggregated away before the data reaches storage. This reduces backend pressure while preserving useful higher-level signals, such as total request counts by service or region.
Leave a comment below or Contact Us if you have any questions!
comments powered by Disqus