- Blog /
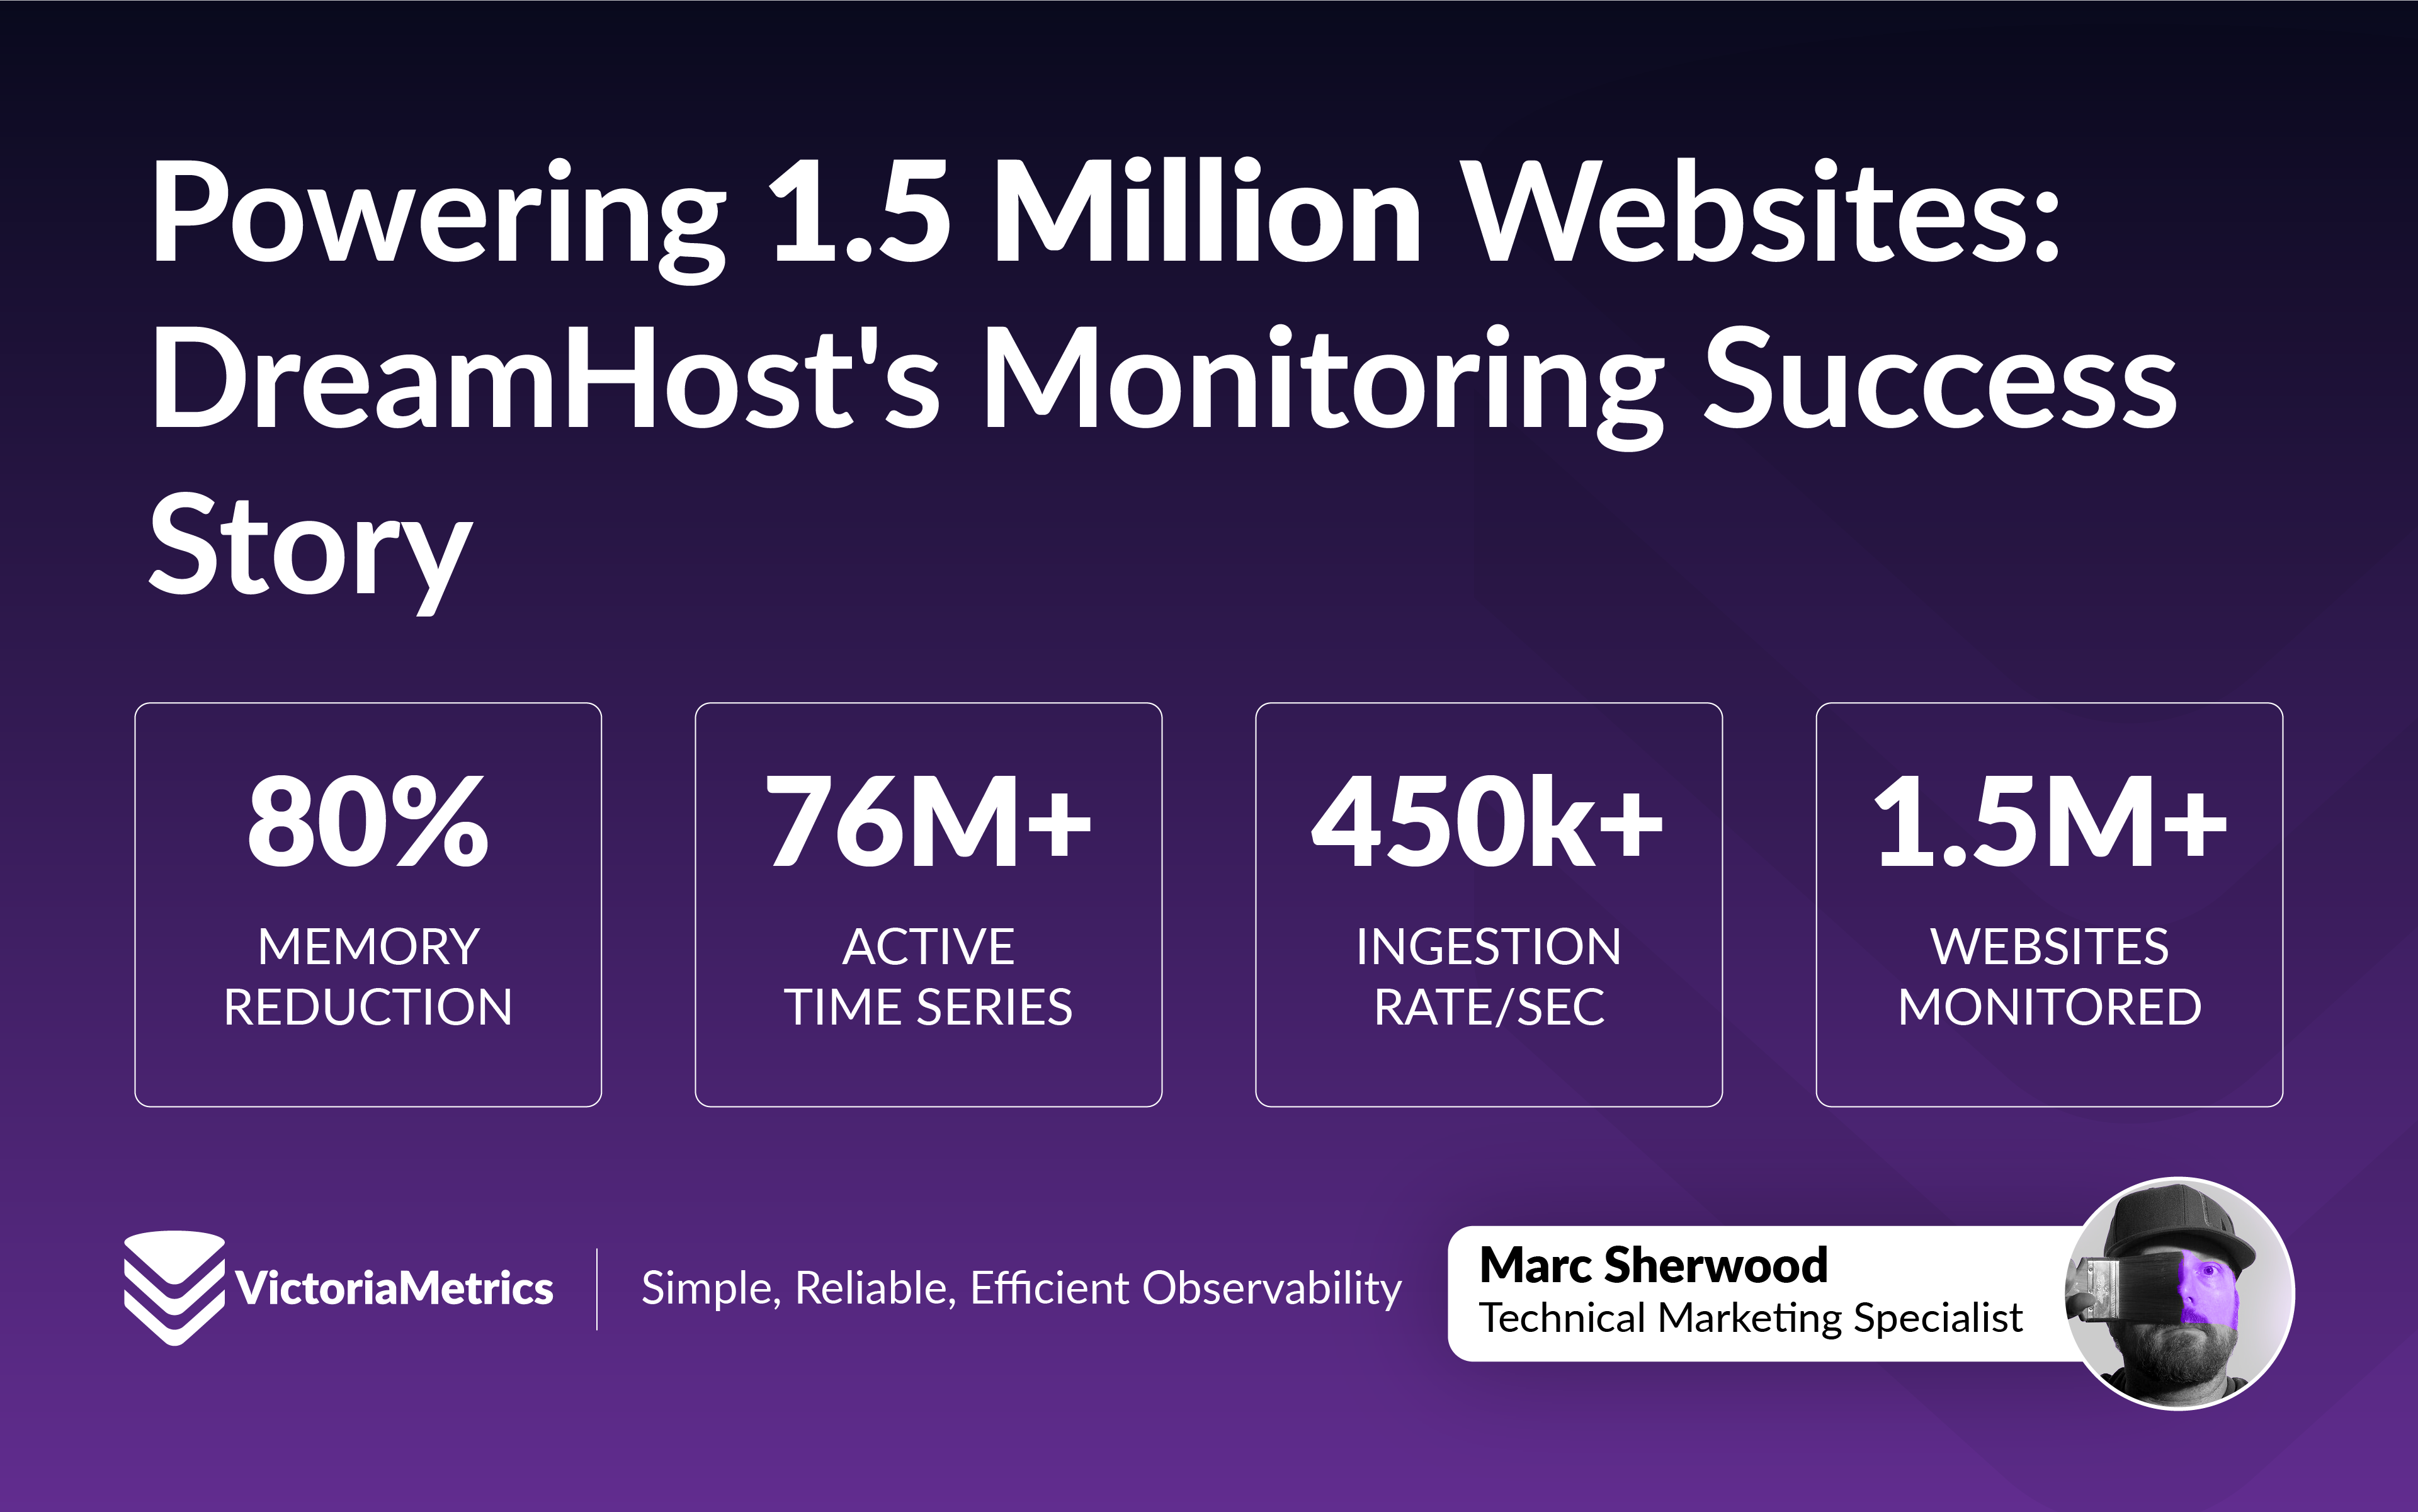
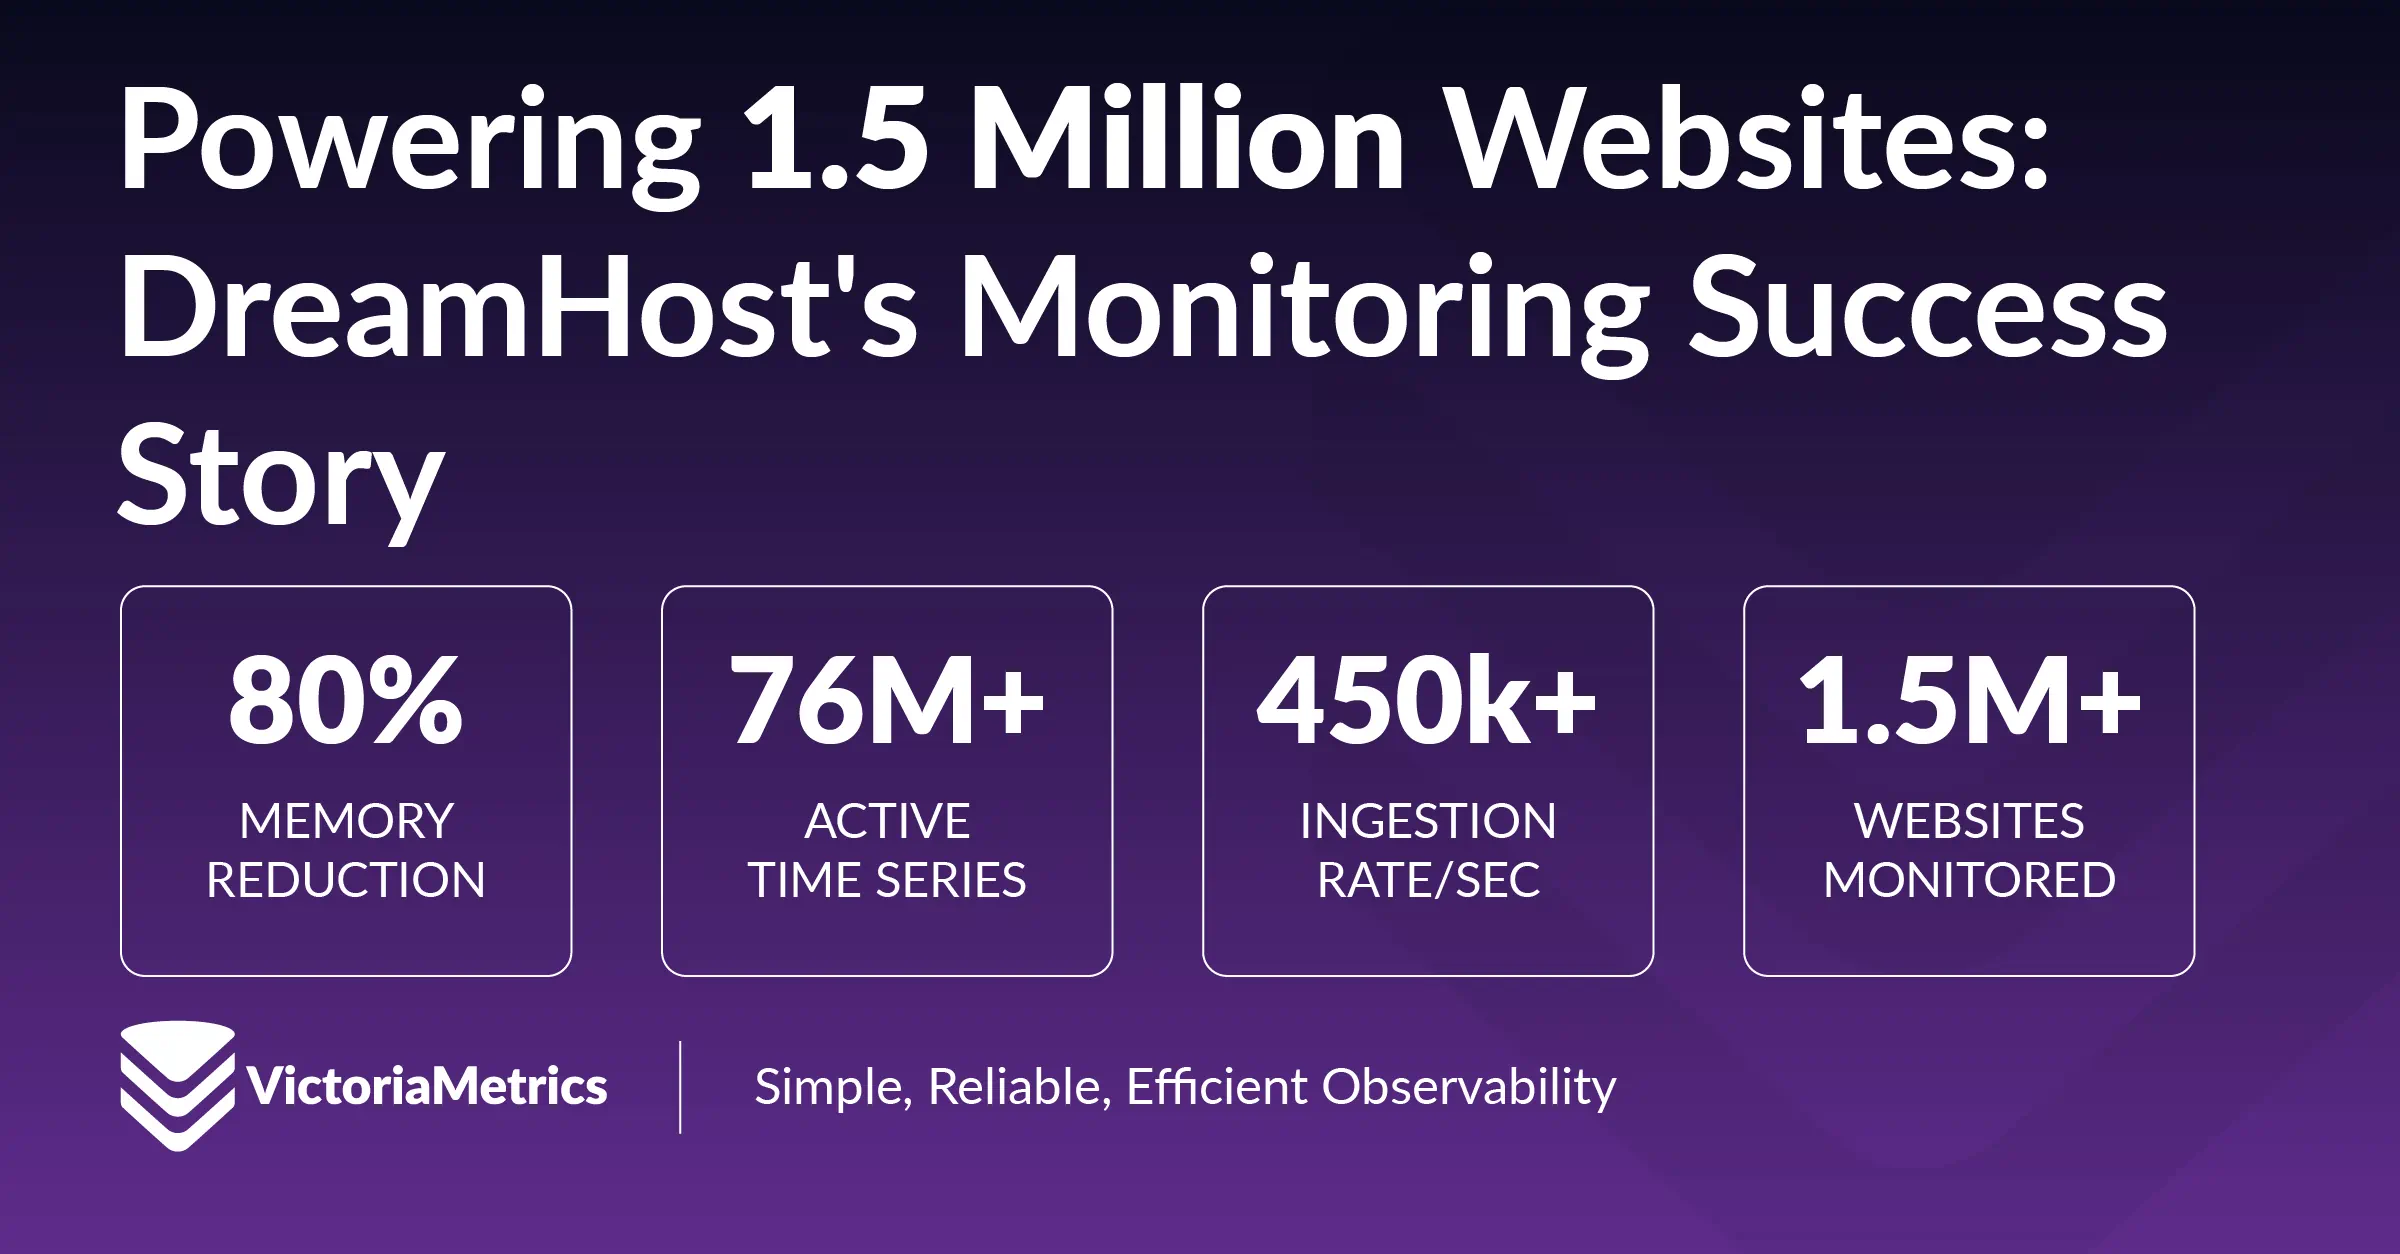
- How DreamHost Slashed Memory Usage by 80% and Scaled to 76 Million Time Series
How DreamHost Slashed Memory Usage by 80% and Scaled to 76 Million Time Series
Share:


For any growing business, there comes a point where the tools that once worked perfectly begin to show their limits. This is especially true for monitoring infrastructure. As your user base, services, and data volumes expand, the pressure on your monitoring stack intensifies. For web hosting leader DreamHost, with over 1.5 million websites to manage, their existing open-source solutions simply couldn’t keep up.
They found their monitoring stack would “fall apart” under the load of high-cardinality data, consuming immense resources just to stay operational. The challenge was clear: find a solution that could handle massive scale without the operational overhead.
The VictoriaMetrics Difference: Scaling Without the Strain
#
After evaluating the usual suspects, DreamHost chose VictoriaMetrics, and the results speak for themselves. The switch wasn’t just an incremental improvement; it was a transformative one.
Here are some of the key gains they experienced:
- An 80% Reduction in Memory Usage: This was the most immediate and impactful result. By switching to VictoriaMetrics, DreamHost dramatically cut their resource consumption compared to their previous Prometheus setup, freeing up budget and engineering time.
- Proven Scale for a Massive Environment: DreamHost is now effortlessly handling over 76 million active time series and ingesting more than 450,000 data points per second. This isn’t a test environment; this is a real-world, high-stakes production workload.
- Effortless Scalability: The best summary comes directly from DreamHost’s Distinguished Engineer, Jordan Tardif, who describes VictoriaMetrics as “Prometheus, that scales with way less effort & resources.”
From Technical Wins to Business Impact
#
The ultimate goal of monitoring isn’t just to collect data; it’s to gain visibility that drives business value. For DreamHost, the stability and efficiency of VictoriaMetrics led to a “massive improvement in visibility” into what is happening with their customers’ websites. This allows them to be more proactive, improve service quality, and build a better customer experience.
See the Full Story or Start Your Own
#
DreamHost’s success is a powerful example of what happens when a great product meets a challenging problem. If their story resonates with you, here’s how you can learn more:
- Talk to Us: Facing similar scaling challenges? Let’s chat about how VictoriaMetrics can help you achieve the same results. Contact Sales
Leave a comment below or Contact Us if you have any questions!
comments powered by Disqus