- Blog /
- Community Question: High Churn Rate Without New Time Series?

Community Question: High Churn Rate Without New Time Series?
Share:


Last week, I saw a user asking for help on Slack:
“My VictoriaMetrics cluster has a very high churn rate at 0:00 every day. However, when I enable
-logNewSeries, I find that these ’new’ time series actually already existed. Why is this happening?”
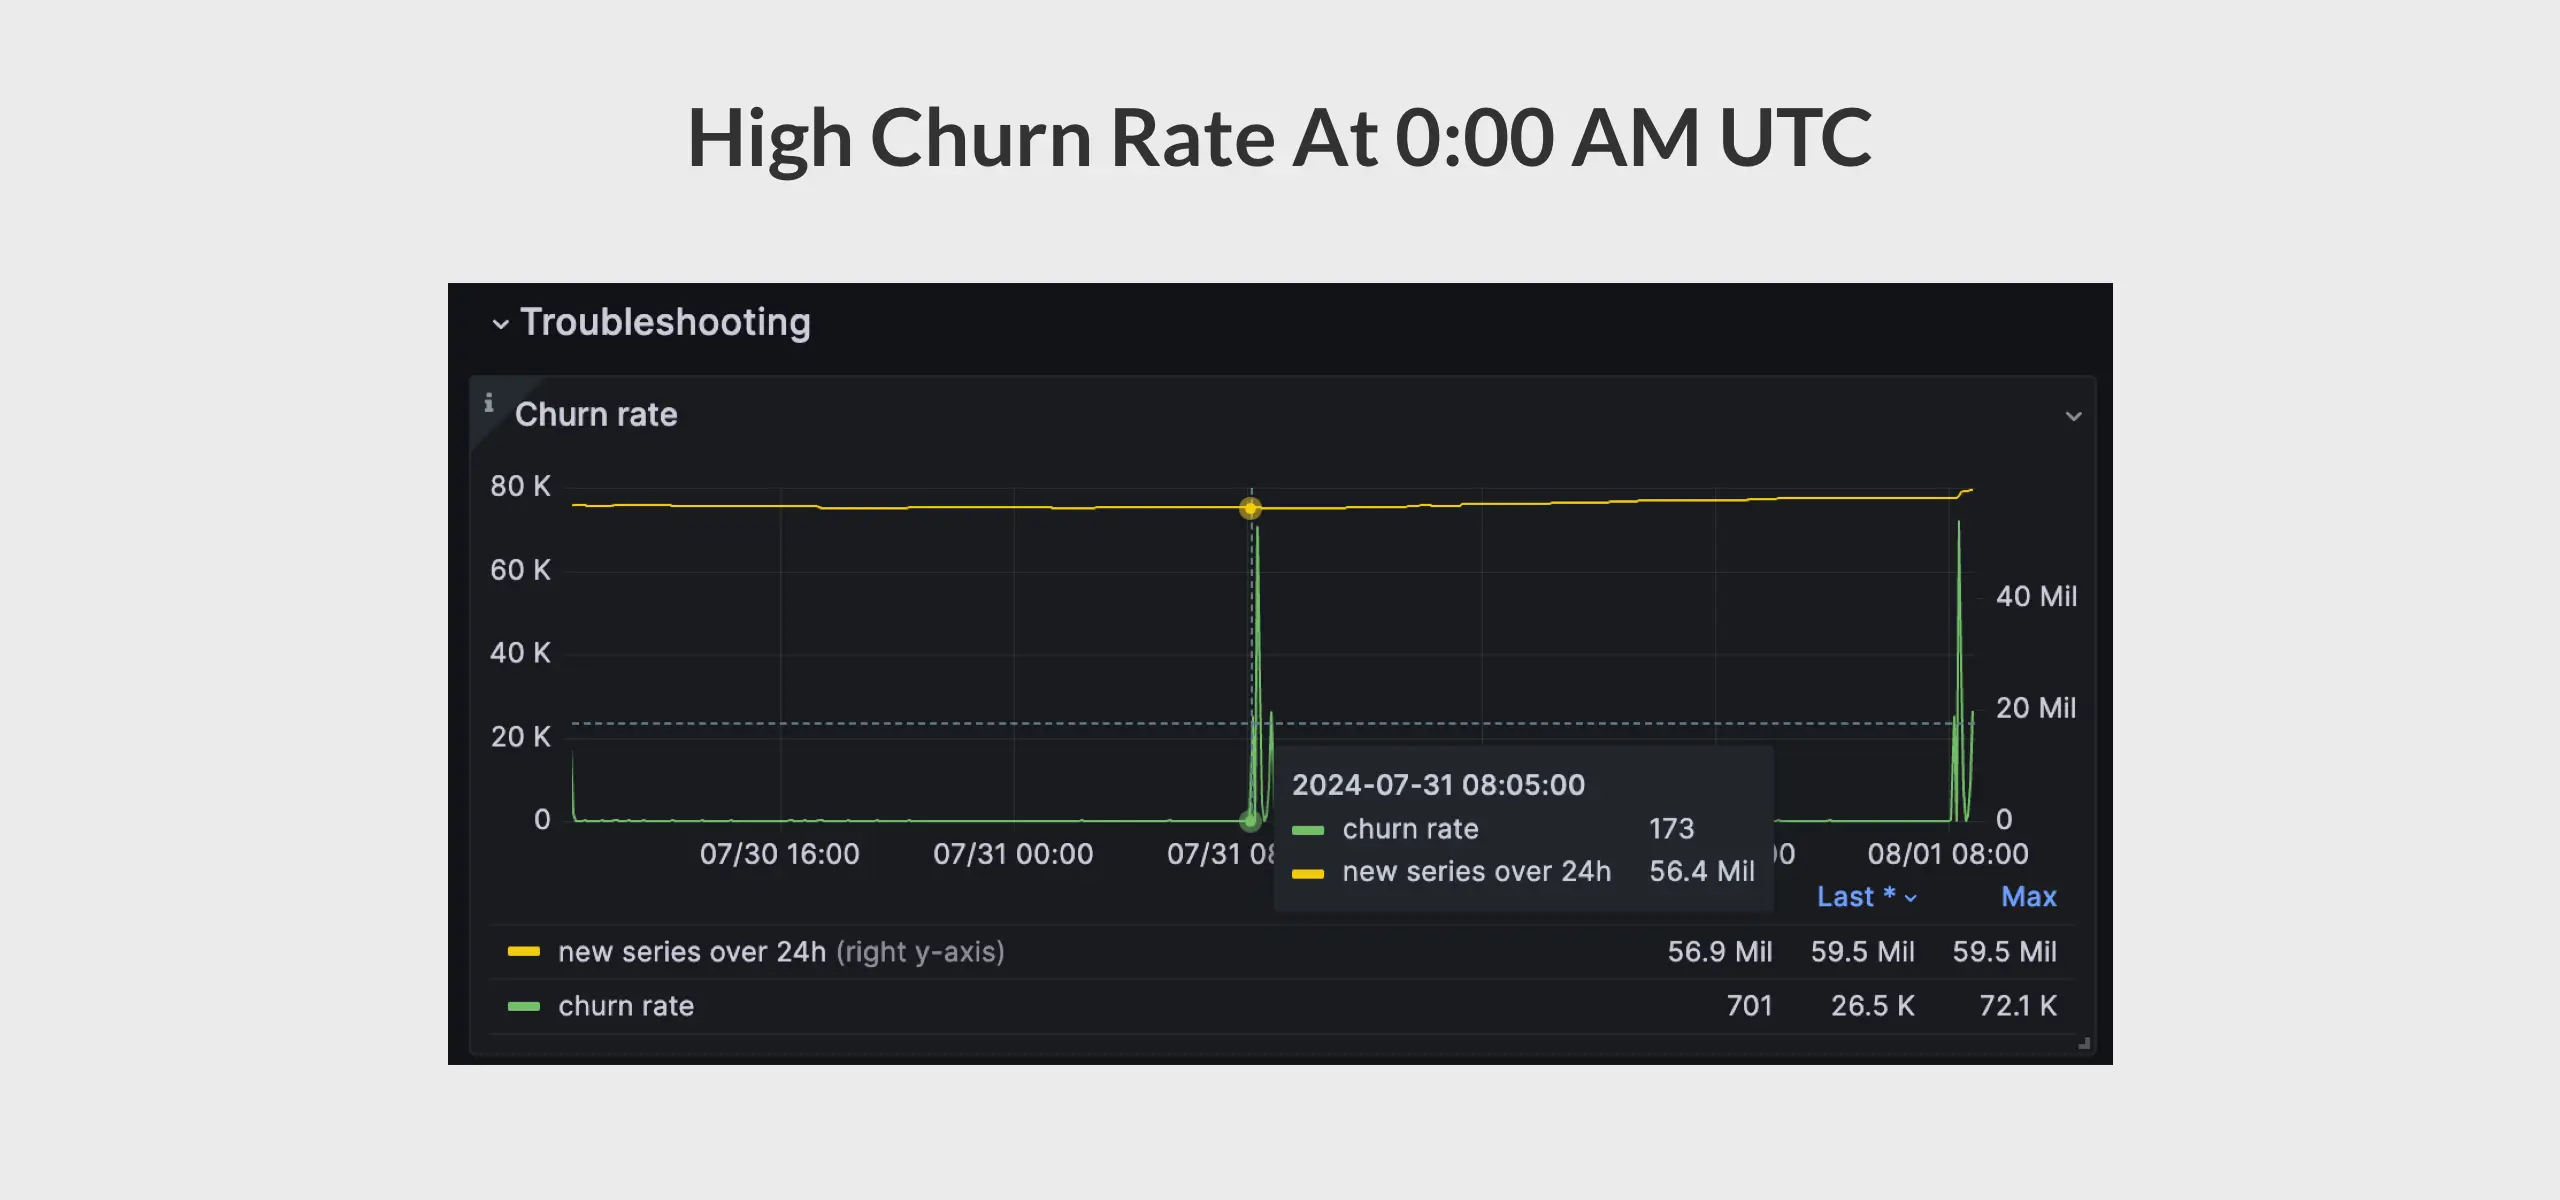 Note: The screenshot was taken in the UTC+8 timezone, so the high churn rate at 8:00 AM occurs at 0:00 AM UTC.
What Is Churn Rate
#
In time series database, churn rate refers to the rate at which new time series appear and replace old time series.
If old time series are constantly substituted with new time series at a high rate, then such a state is called high churn rate. High churn rate has the following negative consequences:
- Increased total number of time series stored in the database.
- Increased size of inverted index.
- Slowed query speed, especially over long time ranges.
In VictoriaMetrics, you can use the following MetricsQL expression to see the churn rate:
sum(rate(vm_new_timeseries_created_total))
Going back to the user’s question, if there are truly no new time series appearing, shouldn’t the churn rate be 0?
In theory, yes. To answer this question, we first need to understand how churn rate is calculated.
How Churn Rate is Calculated in VictoriaMetrics
#
To distinguish between already seen and a new time series, we must register it to the index. When a time series arrives, we query the inverted index to check if this time series was seen before.
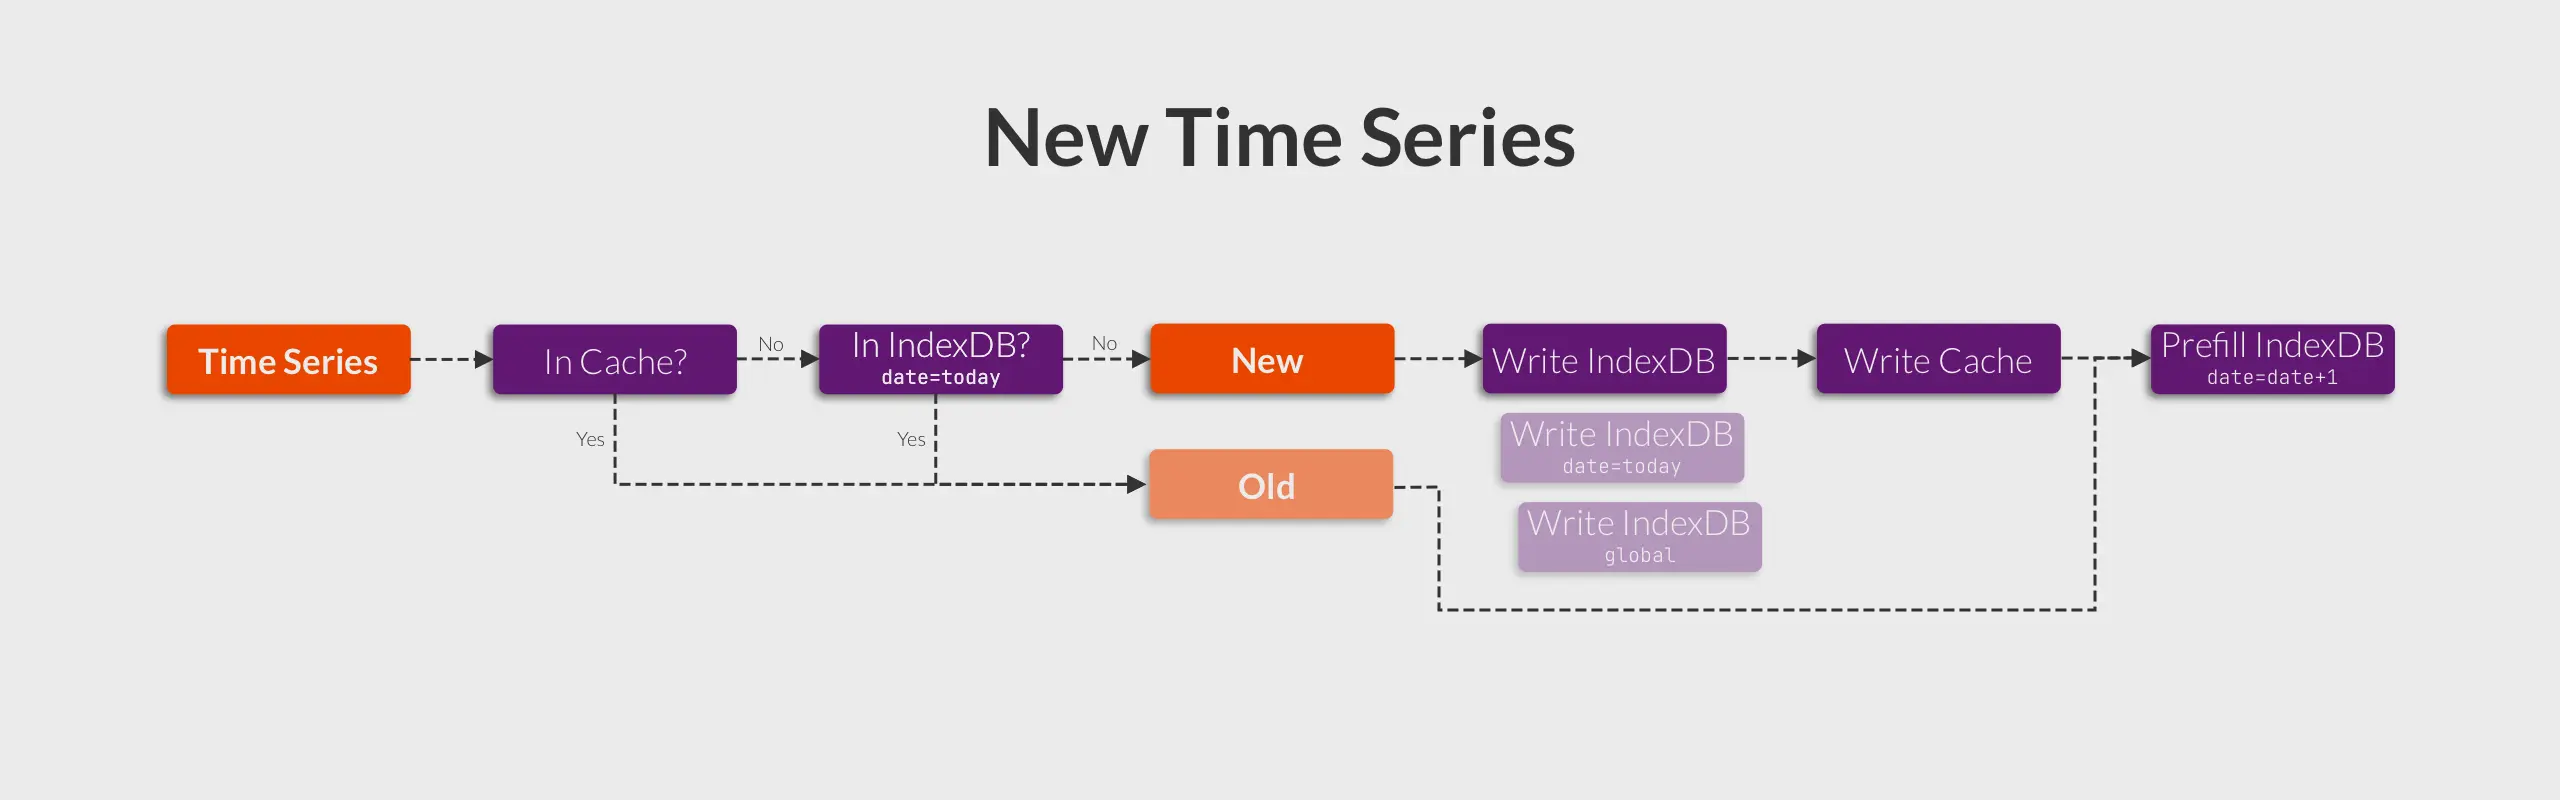
Building on top of this, the most common optimization technique is to use in-memory cache. Consequently, we can create the following flowchart:
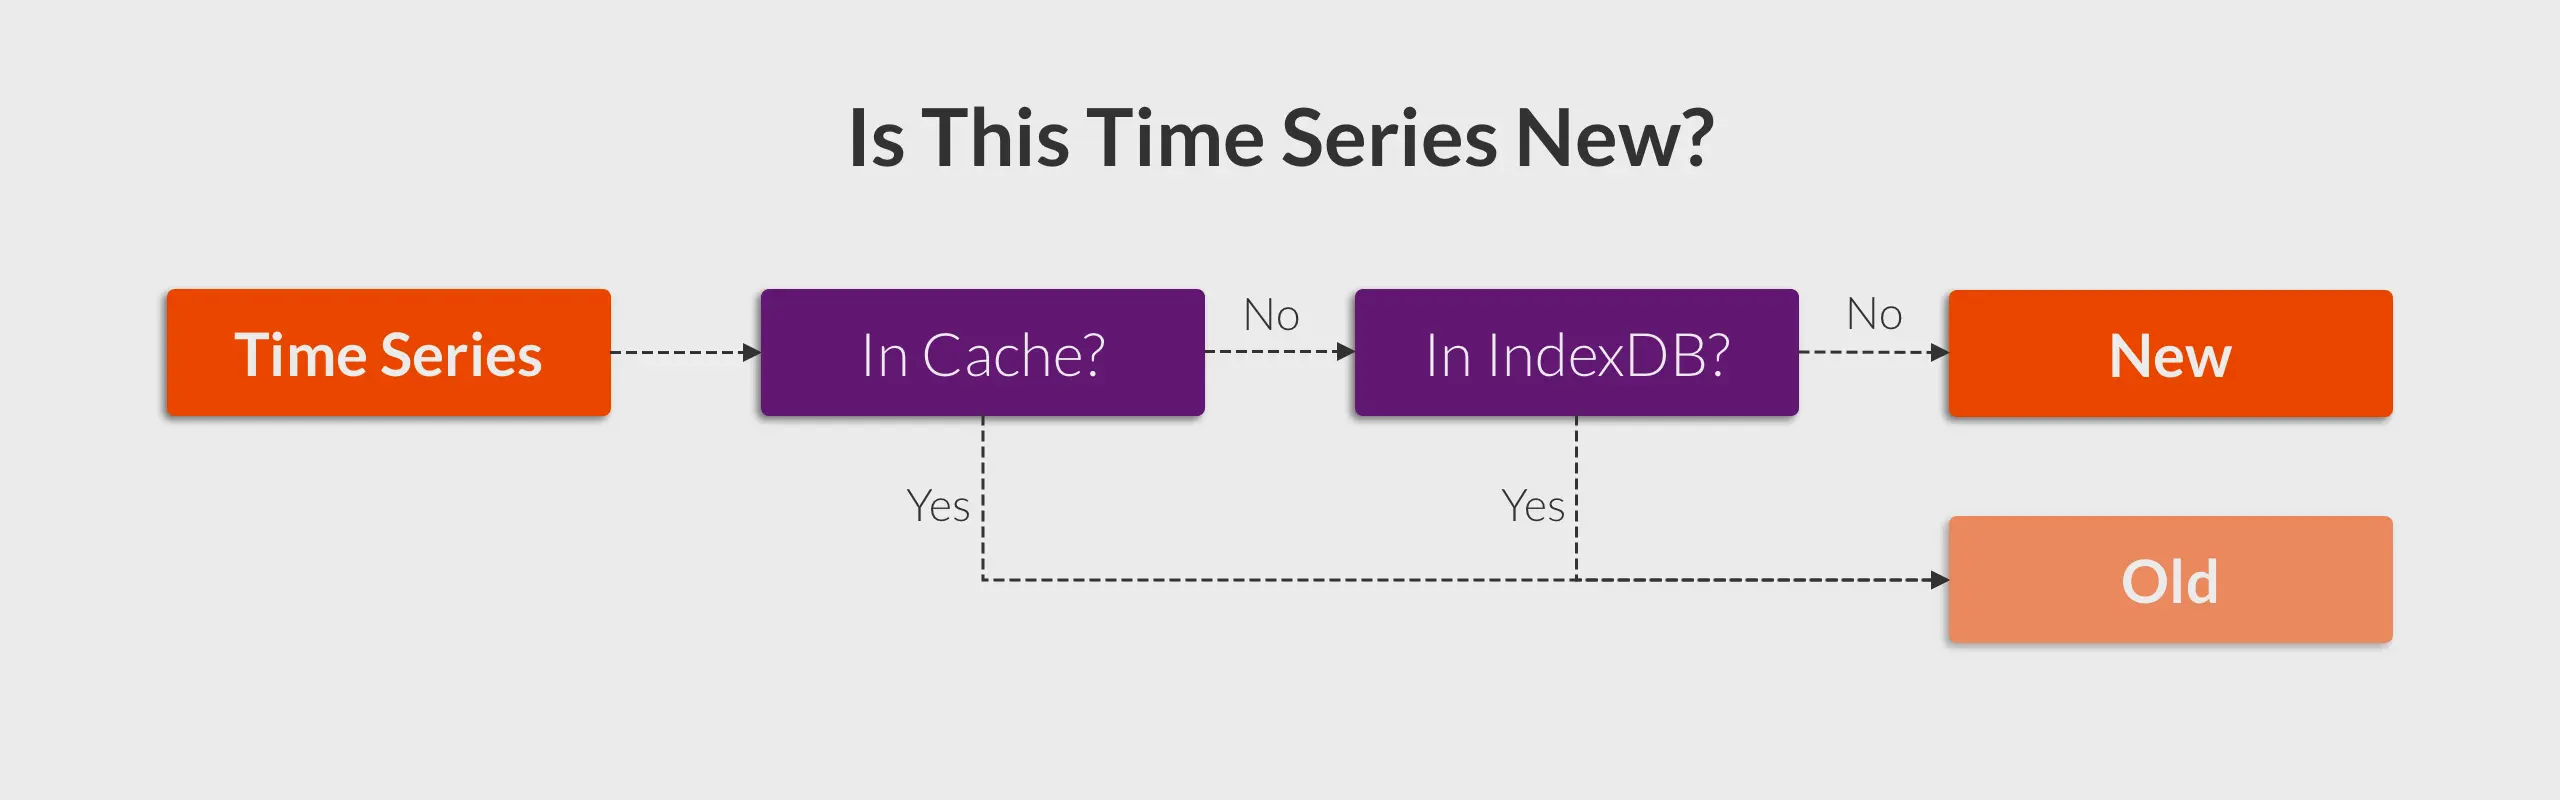
If a time series is identified as ’new,’ it indicates that it is absent both from the cache and the inverted index.
Root Cause
#
As I delved deeper into the code, I uncovered the following code block:
        // Search for TSID for the given mr.MetricNameRaw in the indexdb.
        if is.getTSIDByMetricName(&genTSID, metricNameBuf, date) {
            // Slower path - the TSID has been found in indexdb.
            ...
        }

        // Slowest path - the TSID for the given mr.MetricNameRaw isn't found in indexdb. Create it.
        ...
The date parameter stands out, indicating that data is queried by date. If this is indeed the case, it implies that every time series is considered ’new’ at midnight each day, aligning with the scenario described by the user.
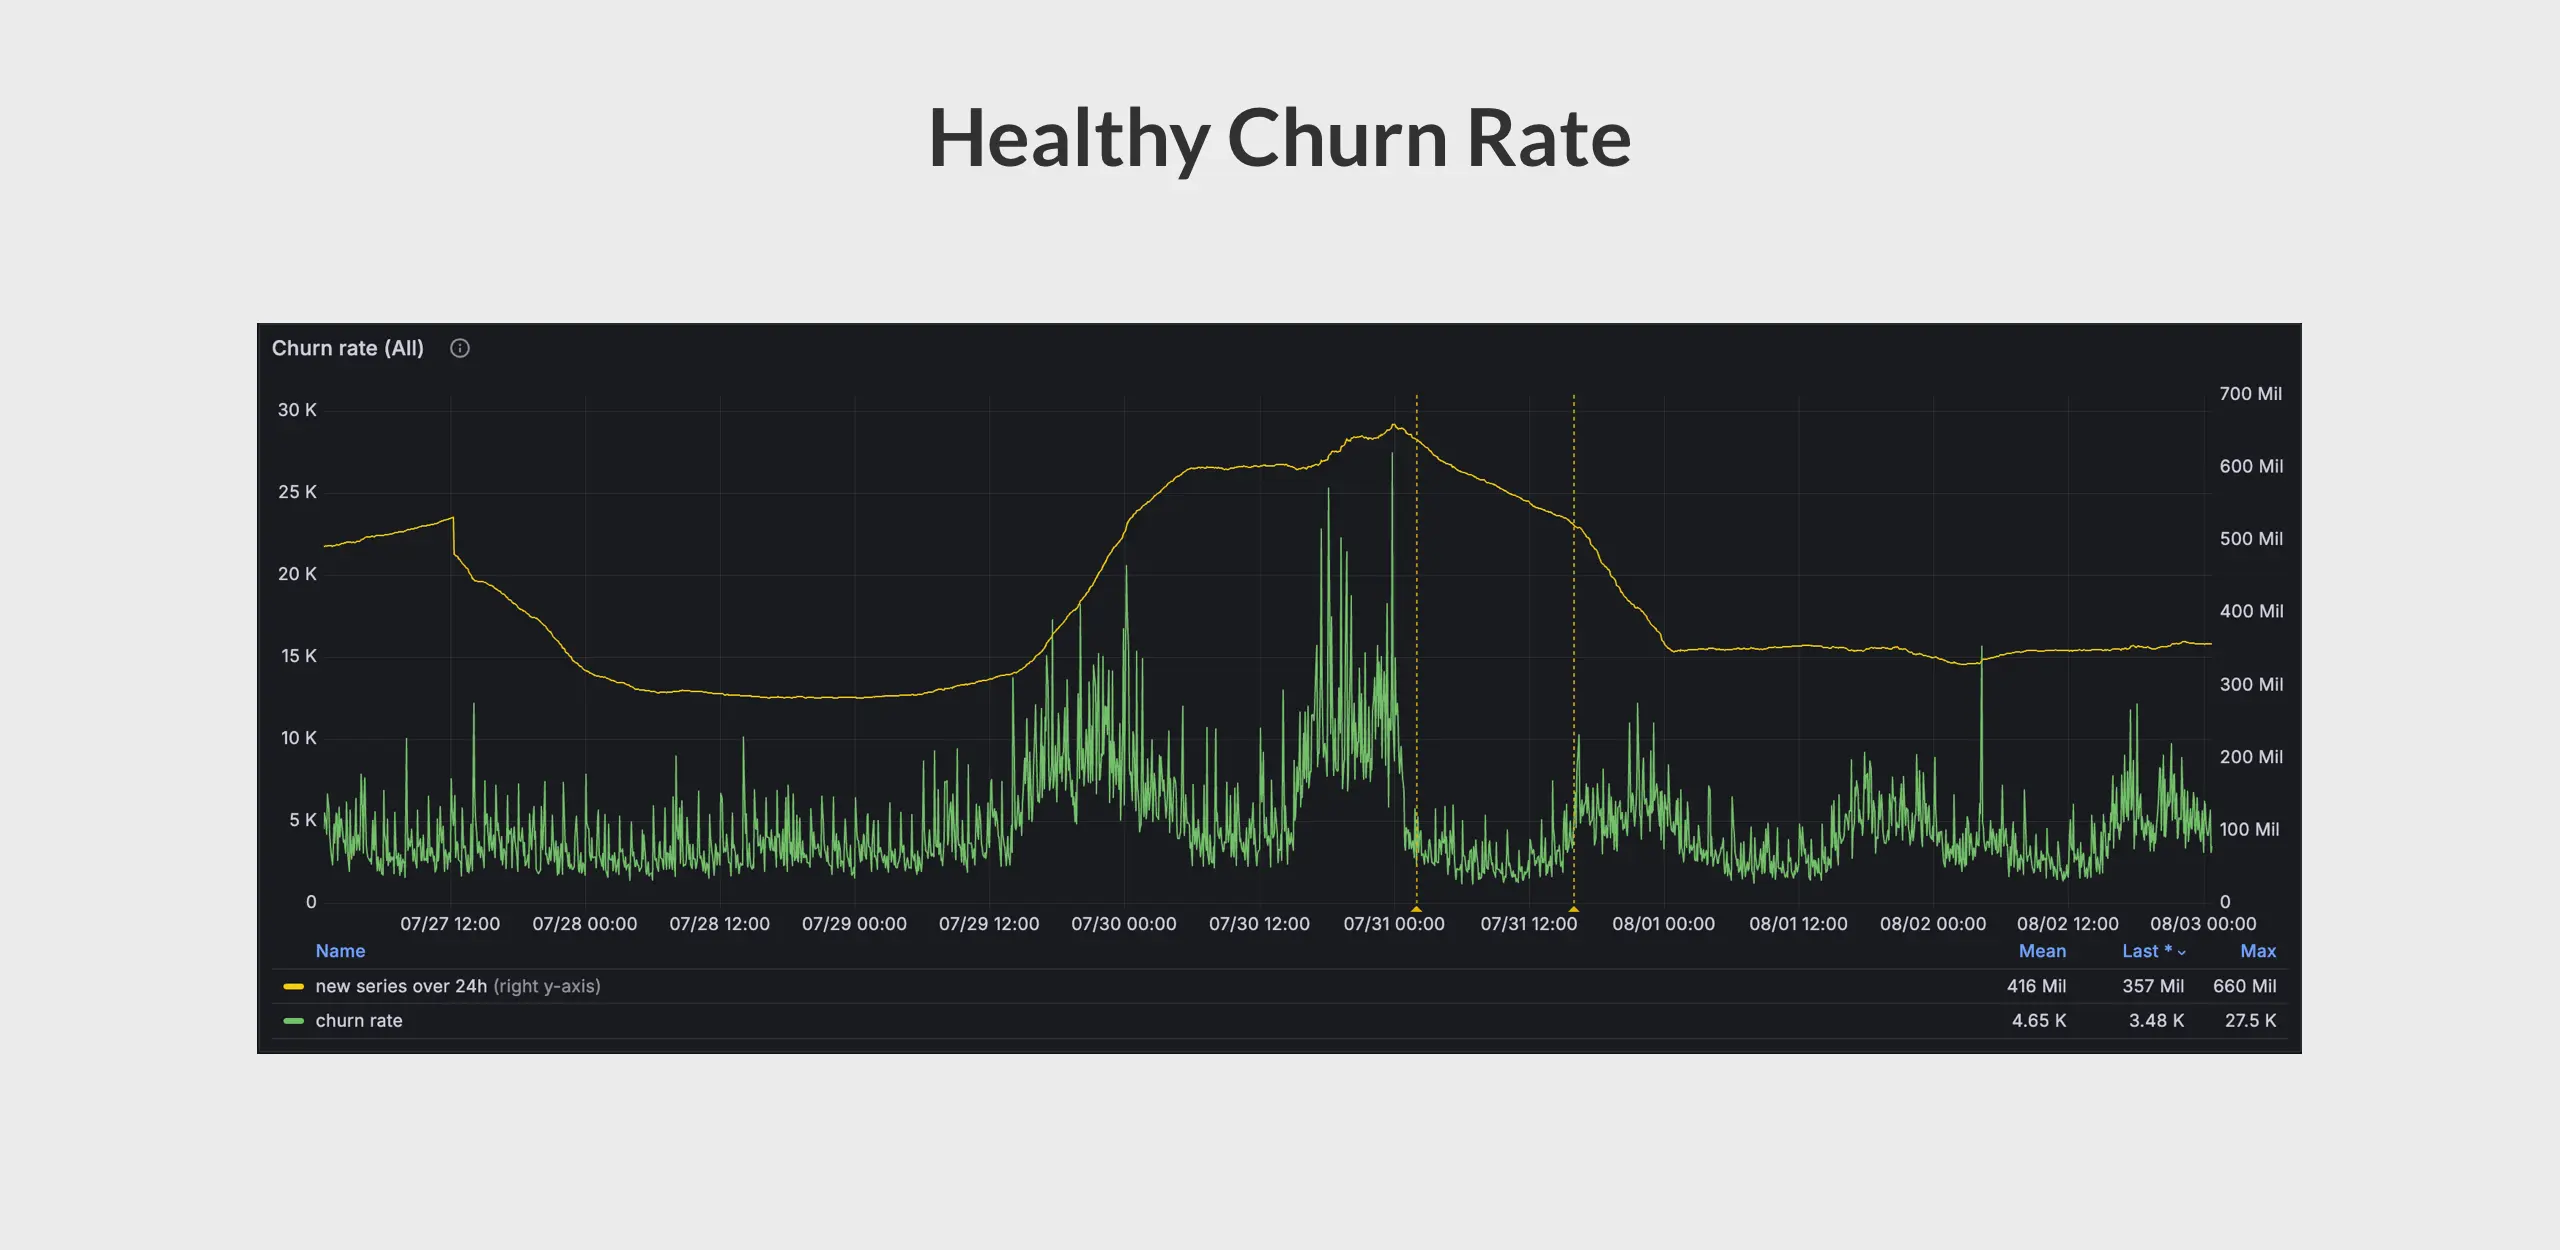
To confirm this scenario, I checked our internal VictoriaMetrics cluster monitoring dashboard. Strangely, the churn rate looks relatively stable and did not show any sudden spikes at midnight each day.
Are there any secrets in the inverted index? I then noticed this method:
func (s *Storage) prefillNextIndexDB(rows []rawRow, mrs []*MetricRow) error {
    d := s.nextRetentionSeconds()
    if d >= 3600 {
        // Fast path: nothing to pre-fill because it is too early.
        // The pre-fill is started during the last hour before the indexdb rotation.
        return nil
    }

    // Slower path: less than hour left for the next indexdb rotation.
    // Pre-populate idbNext with the increasing probability until the rotation.
    ...
}
So basically, VictoriaMetrics will prefill a new inverted index for the next day 1 hour before the indexdb rotation. All data appearing in the last hour will be inserted into the new index in advance. This approach:
- Avoids a churn rate spike that occurs daily at midnight.
- Prevents some stale time series from being prefilled into the new index.
For the problematic scenario described by the user, it can be inferred:
- Most of the time, data exists in either the inverted index or the cache.
- At midnight, data is not in the prefill inverted index or the cache.
 Note: The prefilling of IndexDB only happens 1 hour before daily rotation.
We are now getting very close to the root cause. “But why aren’t the user’s time series in the prefill index and cache?”
I revisited the information provided by the user and discovered the following:
“My (problematic) VictoriaMetrics cluster is primarily used to store downsampling data, which is generated every hour.”
This is a crucial clue: because the index prefilling only happens 1 hour before rotation, it is possible to miss that data. As for the cache, if it has a TTL (Time To Live), one-hour (downsampling interval) might exceed the TTL duration.
After a quick search in the code, I discovered that the TTL is controlled by the cacheExpireDuration flag, with a default value of 30 minutes.
The reason for the issue became clear at this point:
- Each time the user generates downsampling data, it is recorded in both the cache and the inverted index, with a cache TTL of 30 minutes.
- After 30 minutes, the cache expires. An hour later, when the user generates new downsampling data, it cannot be found in the cache but still gets a hit in the (daily) inverted index.
- Since the queries rely on the daily inverted index, they cannot be found at midnight even with index prefilling optimization. This leads to the data being treated as new time series, resulting in a high churn rate.
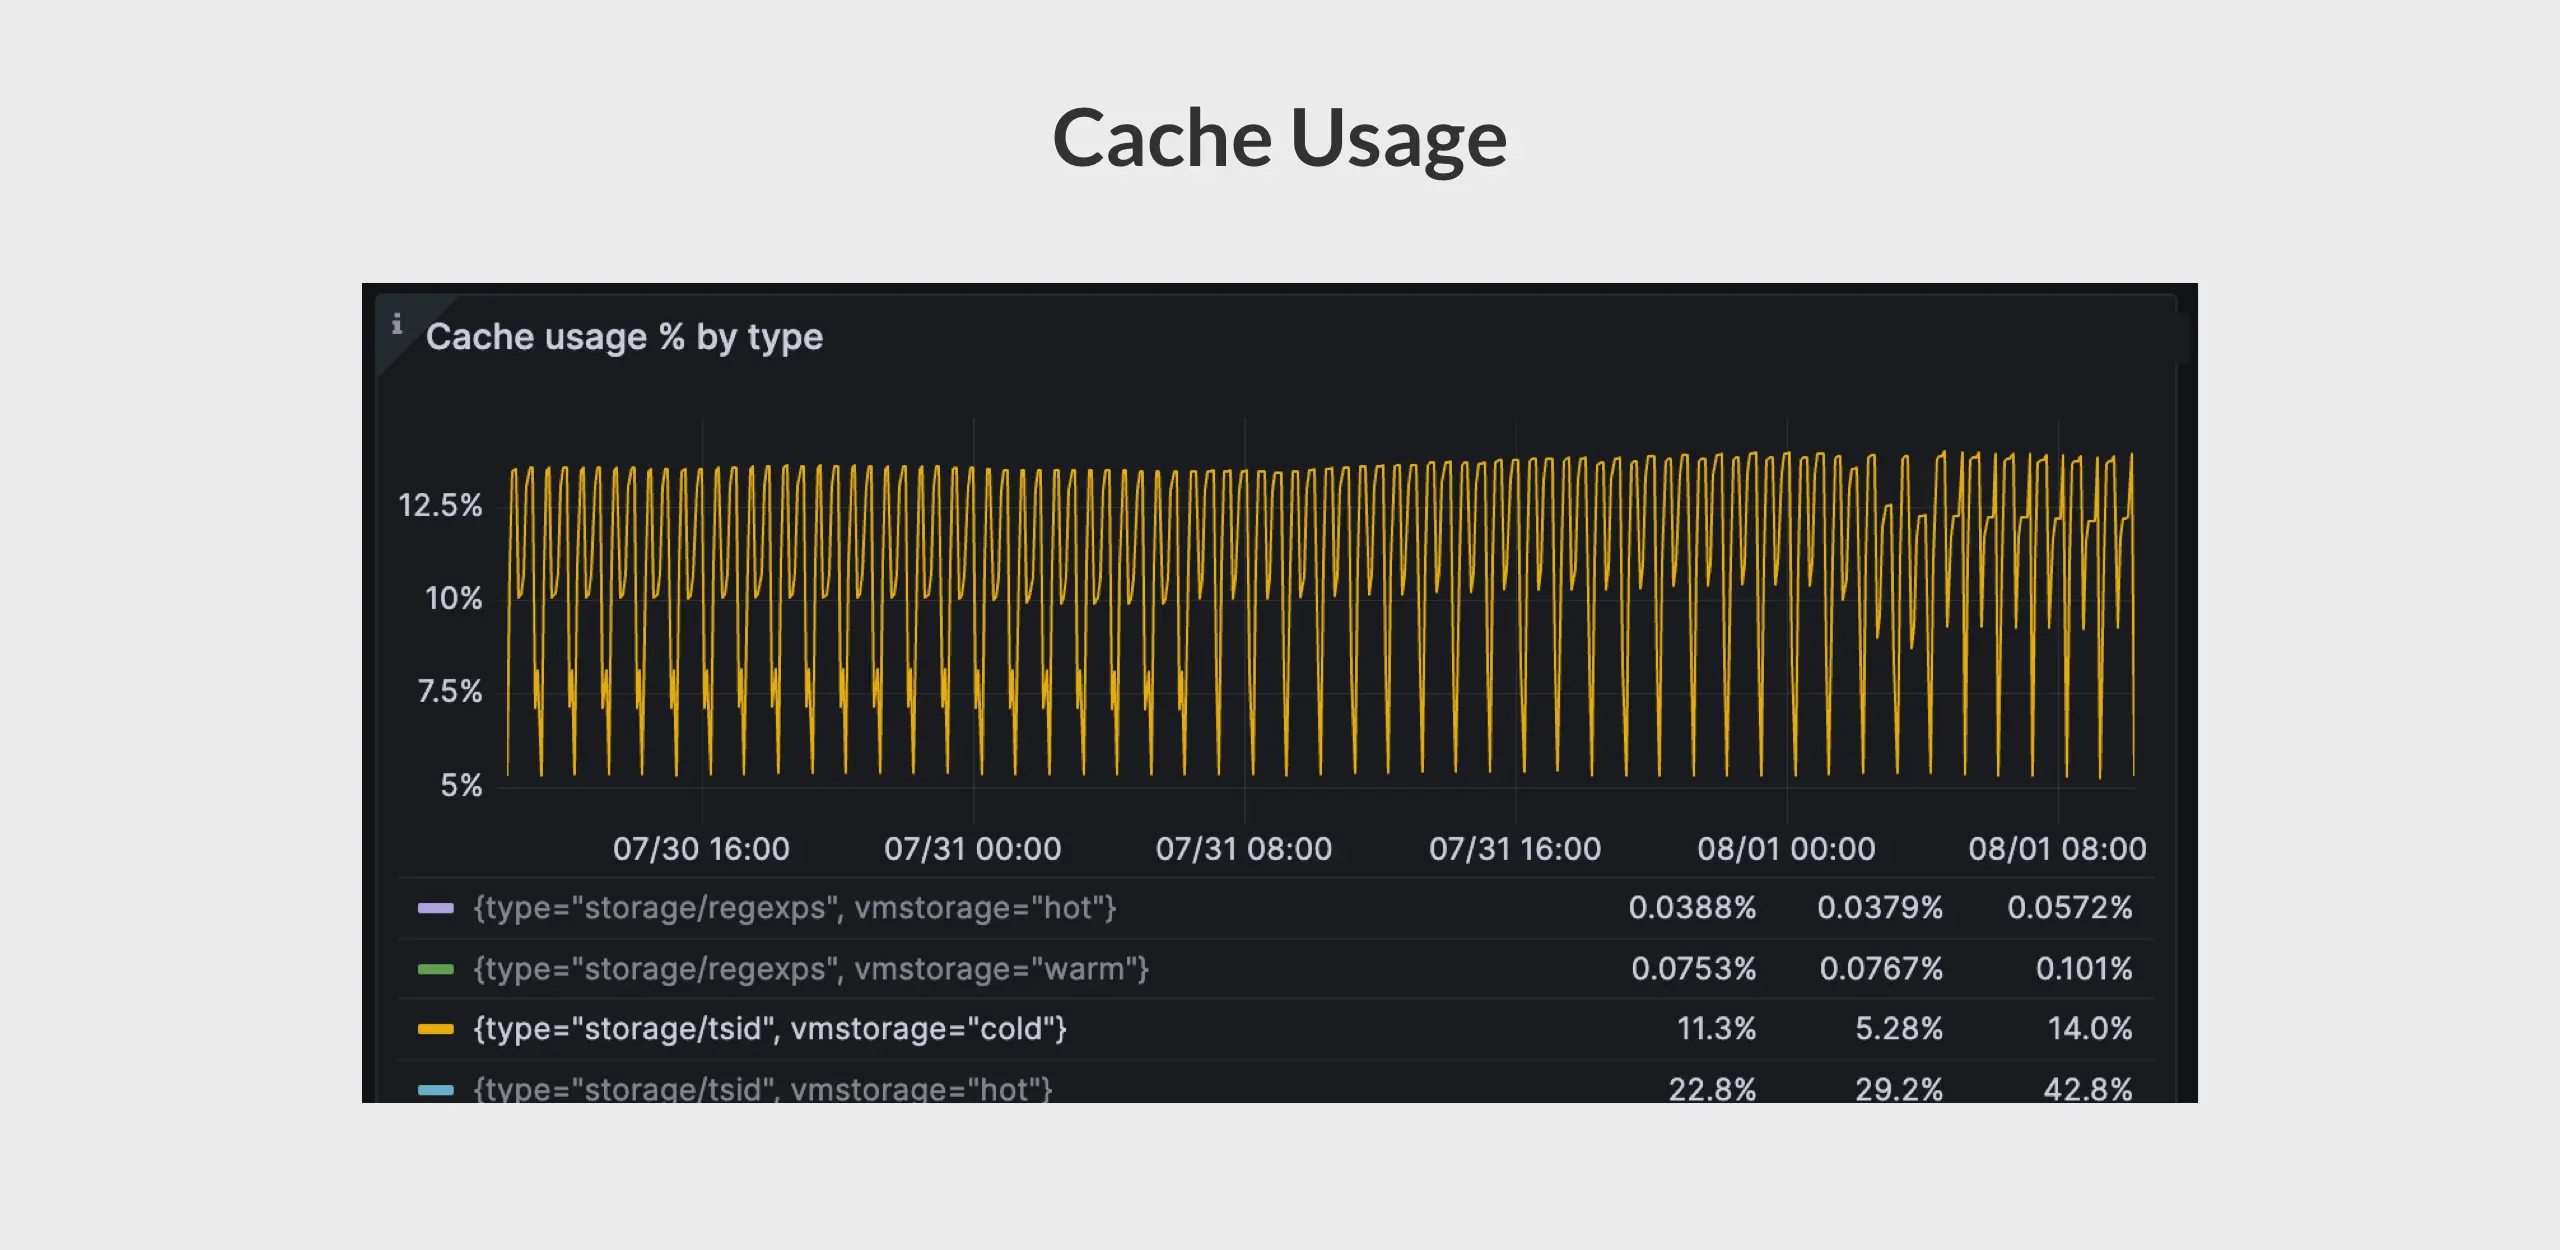
To confirm this, I asked the user to check the cache usage rate to see if it increases with each data generation and decreases after 30 minutes. Here are the results:
How To Fix It
#
It’s quite simple—adjust the cacheExpireDuration to a suitable duration based on the actual intervals of data generation.
Conclusion
#
In this blog post, we explored a high churn rate issue caused by daily index, cache TTL and ingestion interval. Ingesting samples over such a long interval is not common, forcing samples to adopt the slowest path of ingestion. But this case still serves well as an example to illustrate the concept of churn rate and its statistical approach within VictoriaMetrics.
In practice, processing each time series in VictoriaMetrics is more complex. For detailed implementation, please refer to the add function.
Bonus Section
#
After the user adjusted cacheExpireDuration to 90 minutes, covering the interval for generating downsampling data, the cache usage rate should ideally remain stable. However, the cache usage rate, as depicted in the graph, shows a different trend. Do you know why?
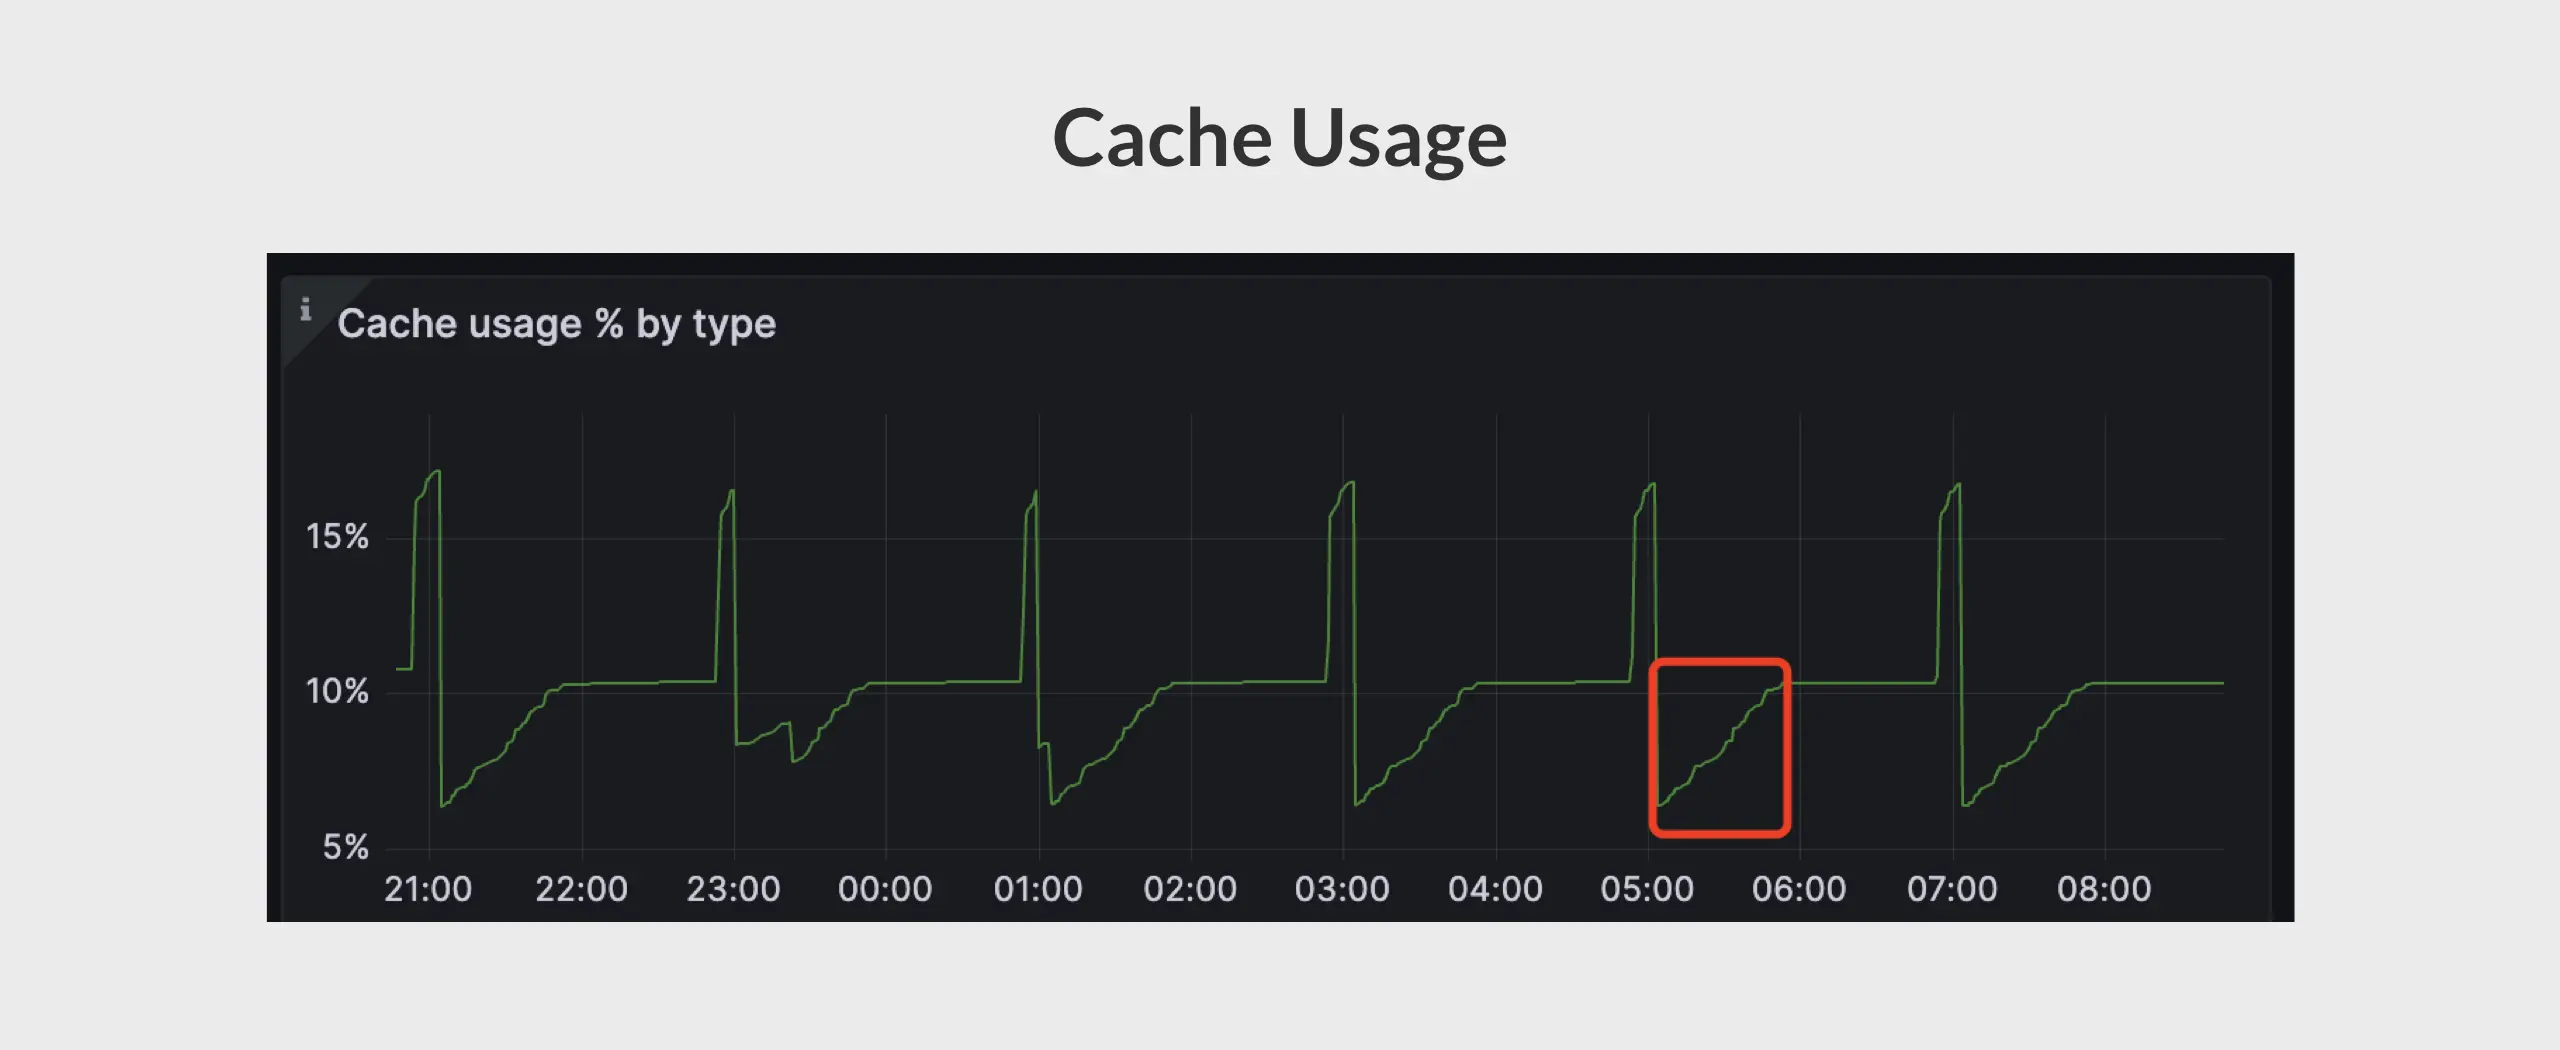
Hint: expirationWatcher.
Leave a comment below or Contact Us if you have any questions!
comments powered by Disqus