From the article
VictoriaMetrics Observability Blog
Author
- Adam Yates
- Aditya Kulkarni
- Adrian Bridgwater
- Agustín Gallego
- Alex Woodie
- Alexander Marshalov
- Aliaksandr Valialkin
- Aman Agarwal
- Antony Savvas
- Artem Navoiev
- Bill Tanner
- Cer6erus
- Claudio Masolo
- David Marshall
- Denys Holius
- Derek Foster
- Diana Todea
- Dima Lazerka
- Dmytro Kozlov
- Emily Foster
- Fintech Herald
- Fred Navruzov
- Gary Flood
- Gonzalo García Labat
- Ivan Yatskevich
- Jaime Hampton
- Jan Sokol
- Jason Bloomberg
- Jason English
- Jean-Jerome Schmidt-Soisson
- Jesús Espino
- Joab Jackson
- John Seekins
- Jose Gomez-Selles
- Julien Menan
- Karan Virdi
- Laveesh Kocher
- Leigh McGowran
- Lindsay Clark
- Marc Sherwood
- Mark Baker
- Martijn Van Best
- Martin Veitch
- Mathias Palmersheim
- Michelle Sebek
- Nick Gibson
- Nikolay Khramchikhin
- Pablo Fernandez
- Phuong Le
- Rafal Szypulka
- Renato Losio
- Richard Speed
- Roman Khavronenko
- Vadim Alekseev
- Vadim Rutkovsky
- Yurii Kravets
- Zakhar Bessarab
- Zhu Jiekun
No matching authors found.
Time Series Database
- Benchmark
- Community
- Company News
- Customer Stories
- Developer Experience
- Distributed Tracing
- Events
- Go
- Go @ VictoriaMetrics
- High Cardinality
- Kubernetes
- Monitoring
- Observability
- Open Source Tech
- OpenTelemetry
- OTLP
- Performance
- PostgreSQL
- Product News
- Tech Talk
- Time Series Database
- VictoriaLogs
- VictoriaMetrics
- VictoriaTraces
No matching categories found.
Filter: Time Series Database
Blog posts
The Rise of Open Source Time Series Databases
Time series databases are essential tools in any software engineer’s toolbelt. Their development has been shaped by user needs and countless open source contributors, leading to the healthy ecosystem of options we see today. In this article, you’ll see how time series databases came about, and why so many are open source.
Community Question: High Churn Rate Without New Time Series?
Troubleshooting Time Series Databases: Where Did My Metrics Go?
I have already recorded metrics in the application, why can’t I see my metrics on Grafana?
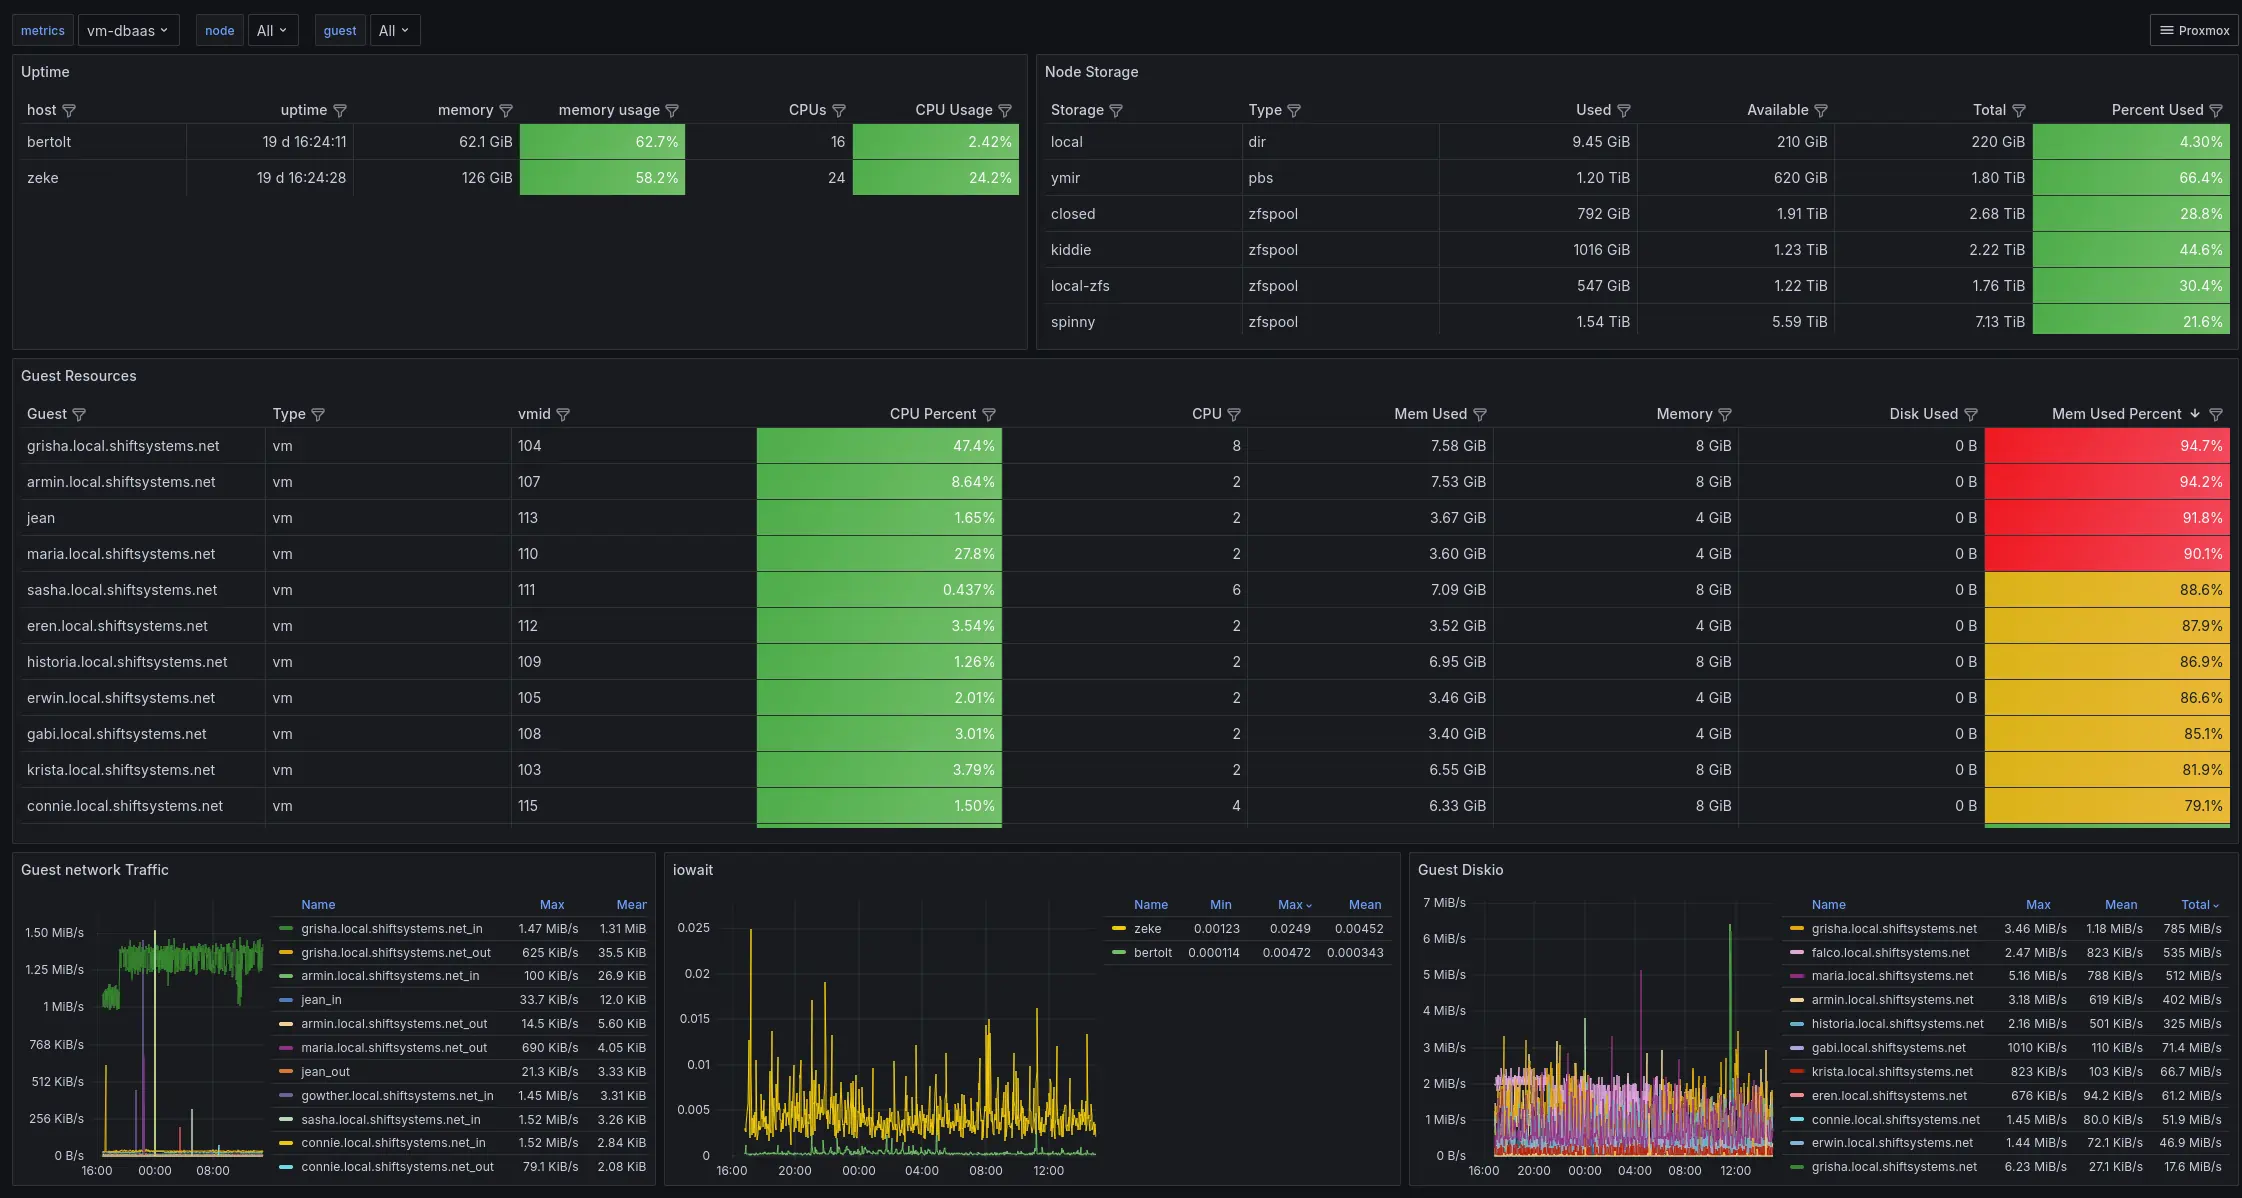
Monitoring Proxmox VE via VictoriaMetrics Cloud
Monitoring Proxmox hypervisor via VictoriaMetrics and Proxmox’s built-in metric server
How to reduce expenses on monitoring: be smarter about data
This blog post is the second in the series of the blog posts based on the talk about ‘How to reduce expenses on monitoring’, stackconf 2023. It is about open-source instruments and techniques from the VictoriaMetrics ecosystem for improving cost-efficiency of monitoring.
How to reduce expenses on monitoring: Swapping in VictoriaMetrics for Prometheus
This blog post is the first in the series of the blog posts based on the talk about ‘How to reduce expenses on monitoring’, stackconf 2023. It is about open-source instruments and techniques from theVictoriaMetrics ecosystem for improving cost-efficiency of monitoring.
Performance optimization techniques in time series databases: sync.Pool for CPU-bound operations
This blog post is the fourth in the series of blog posts based on the talk about ‘Performance optimizations in Go’, GopherCon 2023. It is dedicated to various optimization techniques used in VictoriaMetrics for improving performance and resource usage.
Performance optimization techniques in time series databases: Limiting concurrency
This blog post is a third in the series of the blog posts based on the talk about ‘Performance optimizations in Go’, GopherCon 2023. It is dedicated to various optimization techniques used in VictoriaMetrics for improving performance and resource usage.
Performance optimization techniques in time series databases: function caching
This blog post is a second in the series of the blog posts based on the talk about ‘Performance optimizations in Go’, GopherCon 2023. It is dedicated to various optimization techniques used in VictoriaMetrics for improving performance and resource usage.