From the article
VictoriaMetrics Observability Blog
Author
- Adam Yates
- Aditya Kulkarni
- Adrian Bridgwater
- Agustín Gallego
- Alex Woodie
- Alexander Marshalov
- Aliaksandr Valialkin
- Aman Agarwal
- Antony Savvas
- Artem Navoiev
- Bill Tanner
- Cer6erus
- Claudio Masolo
- David Marshall
- Denys Holius
- Derek Foster
- Diana Todea
- Dima Lazerka
- Dmytro Kozlov
- Emily Foster
- Fintech Herald
- Fred Navruzov
- Gary Flood
- Gonzalo García Labat
- Ivan Yatskevich
- Jaime Hampton
- Jan Sokol
- Jason Bloomberg
- Jason English
- Jean-Jerome Schmidt-Soisson
- Jesús Espino
- Joab Jackson
- John Seekins
- Jose Gomez-Selles
- Julien Menan
- Karan Virdi
- Laveesh Kocher
- Leigh McGowran
- Lindsay Clark
- Marc Sherwood
- Mark Baker
- Martijn Van Best
- Martin Veitch
- Mathias Palmersheim
- Michelle Sebek
- Nick Gibson
- Nikolay Khramchikhin
- Pablo Fernandez
- Phuong Le
- Rafal Szypulka
- Renato Losio
- Richard Speed
- Roman Khavronenko
- Vadim Alekseev
- Vadim Rutkovsky
- Yurii Kravets
- Zakhar Bessarab
- Zhu Jiekun
No matching authors found.
Observability
- Benchmark
- Community
- Company News
- Customer Stories
- Developer Experience
- Distributed Tracing
- Events
- Go
- Go @ VictoriaMetrics
- High Cardinality
- Kubernetes
- Monitoring
- Observability
- Open Source Tech
- OpenTelemetry
- OTLP
- Performance
- PostgreSQL
- Product News
- Tech Talk
- Time Series Database
- VictoriaLogs
- VictoriaMetrics
- VictoriaTraces
No matching categories found.
Filter: Observability
Blog posts
The Year-2 Price Cliff: What Your Observability Stack Really Costs Over 3 Years
Why aggressive year-1 discounts in observability often lead to 2–3x renewal bills, plus a simple 3-year TCO framework and five questions to ask before signing.
The Life of a Metric
Follow a single metric through its whole life inside VictoriaMetrics: born as a counter in your process, exported over the wire, given an identity and an inverted-index entry, written through an LSM tree, compressed into columnar blocks on disk, read back by a rate() query, downsampled as it ages, and finally deleted when retention runs out.
Observability's Sixth Sense: Grounding Anomaly Detection in Reality
Learn how VictoriaMetrics combines machine learning, MCP, and natural-language workflows to simplify observability with anomaly detection and reduce operational overhead.
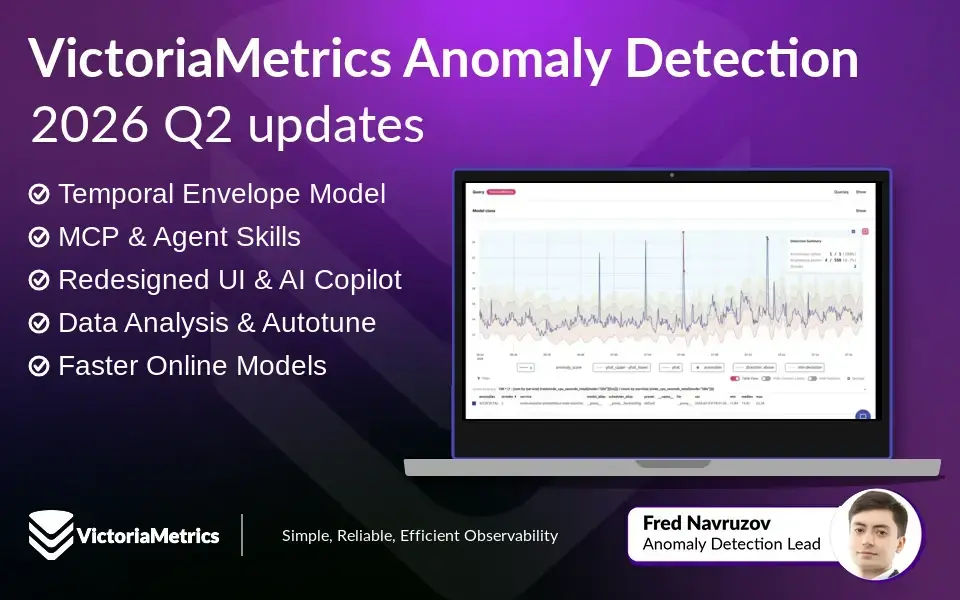
What's new in VictoriaMetrics Anomaly Detection (Q2 2026)
The Q2 2026 vmanomaly update introduces Temporal Envelope, a redesigned UI, faster online-model execution, and an AI-assisted workflow that turns natural-language monitoring goals into tested configurations and alerting rules.
GPU Observability with the OpenLIT Collector and the VictoriaMetrics observability stack
Monitor NVIDIA, AMD, and Intel GPUs with the OpenLIT OpenTelemetry GPU Collector and the VictoriaMetrics stack: eBPF CUDA kernel tracing, OTel hardware semantic conventions, MetricsQL queries, recording rules, and alerts.
Observability for LLM Apps and Agents: OpenLIT SDK + VictoriaMetrics observability stack
See practical examples on monitoring LLM applications and Agents with OpenLIT and VictoriaMetrics observability stack. See real examples of the deployment manifests, alerting rules and Grafana dashboard.
How VictoriaLogs Stores Your Logs in a Columnar Layout
A beginner-friendly tour of how VictoriaLogs stores your logs on disk: streams and daily partitions, immutable parts, blocks and columns, and the files inside a part (timestamps, values, bloom filters, column headers, and the two-level index) that let a query read only the bytes it needs.
Multi-tiered Observability: A Practical Way to Handle Diverse Workloads
Discover multi-tier observability architecture with VictoriaMetrics OSS. Learn how to isolate default, high-cardinality, and business-critical workloads into separate tiers with optimized retention periods, ingestion resolution, cardinality limits, alerting policies, and cost controls.
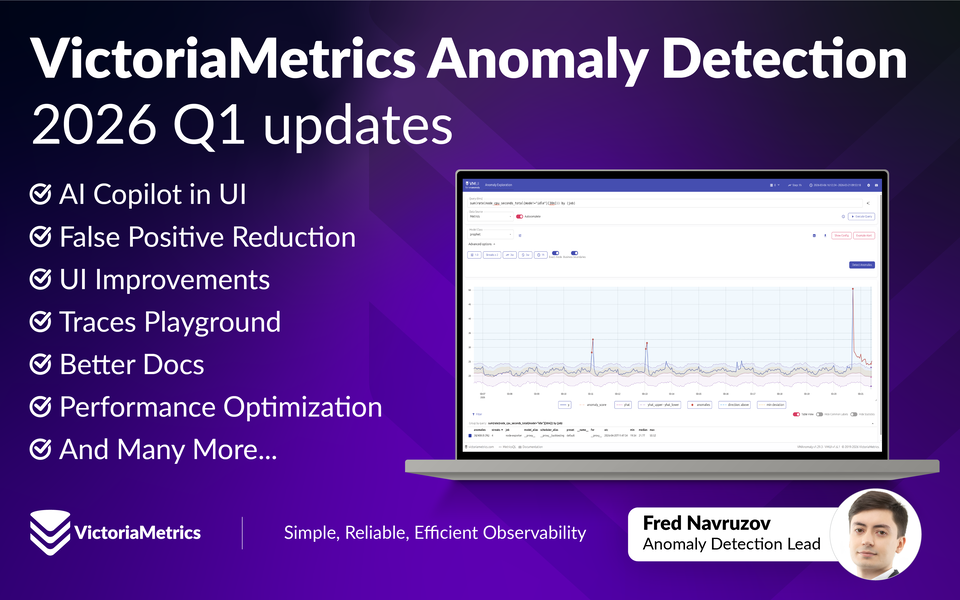
What's new in VictoriaMetrics Anomaly Detection (Q1 2026)
Q1 2026 brought incremental but important updates to VictoriaMetrics Anomaly Detection: UI improvements, AI assistance inside the UI, a public traces playground, new false-positive reduction controls, and continued resource optimizations.