From the article
Monitoring - Insights from VictoriaMetrics
Author
- Adam Yates
- Aditya Kulkarni
- Adrian Bridgwater
- Agustín Gallego
- Alex Woodie
- Alexander Marshalov
- Aliaksandr Valialkin
- Aman Agarwal
- Antony Savvas
- Artem Navoiev
- Bill Tanner
- Cer6erus
- Claudio Masolo
- David Marshall
- Denys Holius
- Derek Foster
- Diana Todea
- Dima Lazerka
- Dmytro Kozlov
- Emily Foster
- Fintech Herald
- Fred Navruzov
- Gary Flood
- Gonzalo García Labat
- Ivan Yatskevich
- Jaime Hampton
- Jan Sokol
- Jason Bloomberg
- Jason English
- Jean-Jerome Schmidt-Soisson
- Jesús Espino
- Joab Jackson
- John Seekins
- Jose Gomez-Selles
- Julien Menan
- Karan Virdi
- Laveesh Kocher
- Leigh McGowran
- Lindsay Clark
- Marc Sherwood
- Mark Baker
- Martijn Van Best
- Martin Veitch
- Mathias Palmersheim
- Michelle Sebek
- Nick Gibson
- Nikolay Khramchikhin
- Pablo Fernandez
- Phuong Le
- Rafal Szypulka
- Renato Losio
- Richard Speed
- Roman Khavronenko
- Vadim Alekseev
- Vadim Rutkovsky
- Yurii Kravets
- Zakhar Bessarab
- Zhu Jiekun
No matching authors found.
Monitoring
- Benchmark
- Community
- Company News
- Customer Stories
- Developer Experience
- Distributed Tracing
- Events
- Go
- Go @ VictoriaMetrics
- High Cardinality
- Kubernetes
- Monitoring
- Observability
- Open Source Tech
- OpenTelemetry
- OTLP
- Performance
- PostgreSQL
- Product News
- Tech Talk
- Time Series Database
- VictoriaLogs
- VictoriaMetrics
- VictoriaTraces
No matching categories found.
Filter: Monitoring
Blog posts
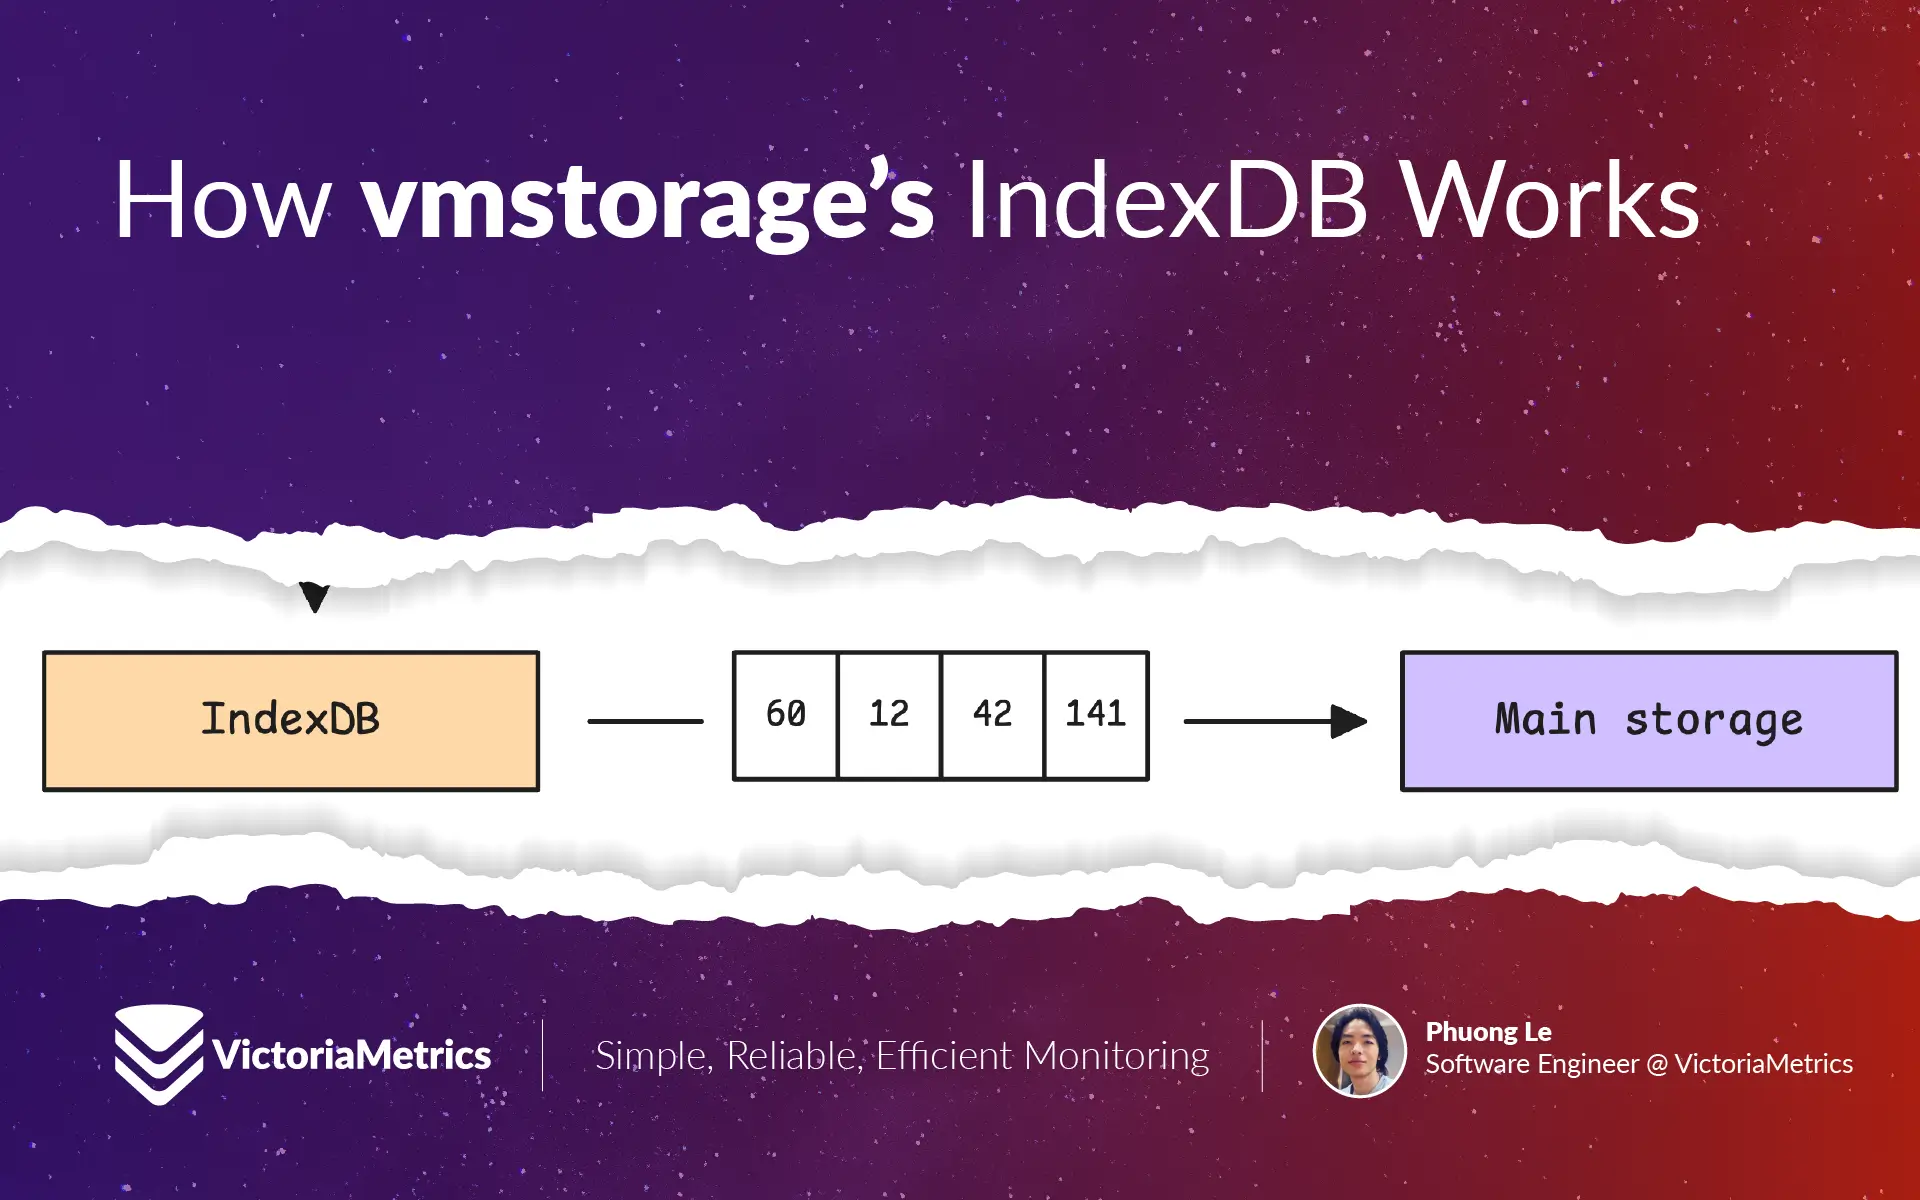
How vmstorage's IndexDB Works
IndexDB acts as vmstorage’s memory - it remembers which numbers (TSIDs) belong to which metrics, making sure your queries get answered fast. This article walks through how this system works, from the way it organizes data to how it keeps track of millions of timeseries.
How vmstorage Processes Data: Retention, Merging, Deduplication,...
vmstorage takes data from vminsert through a concurrency limiter, creates TSIDs for each row, and puts them in memory buffers. Every few seconds, it moves data to storage parts on disk. The system merges parts, removes duplicates, and cleans old data. This turns raw metrics into data users can search.
How vmstorage Handles Data Ingestion From vminsert
This article explains how vmstorage processes incoming metrics, assigns unique IDs to timeseries, and organizes everything into different types of storage parts. The whole system is pretty clever - it uses in-memory buffers for speed, smart compression to save space, and has various watchdogs keeping an eye on things like disk space and data retention.
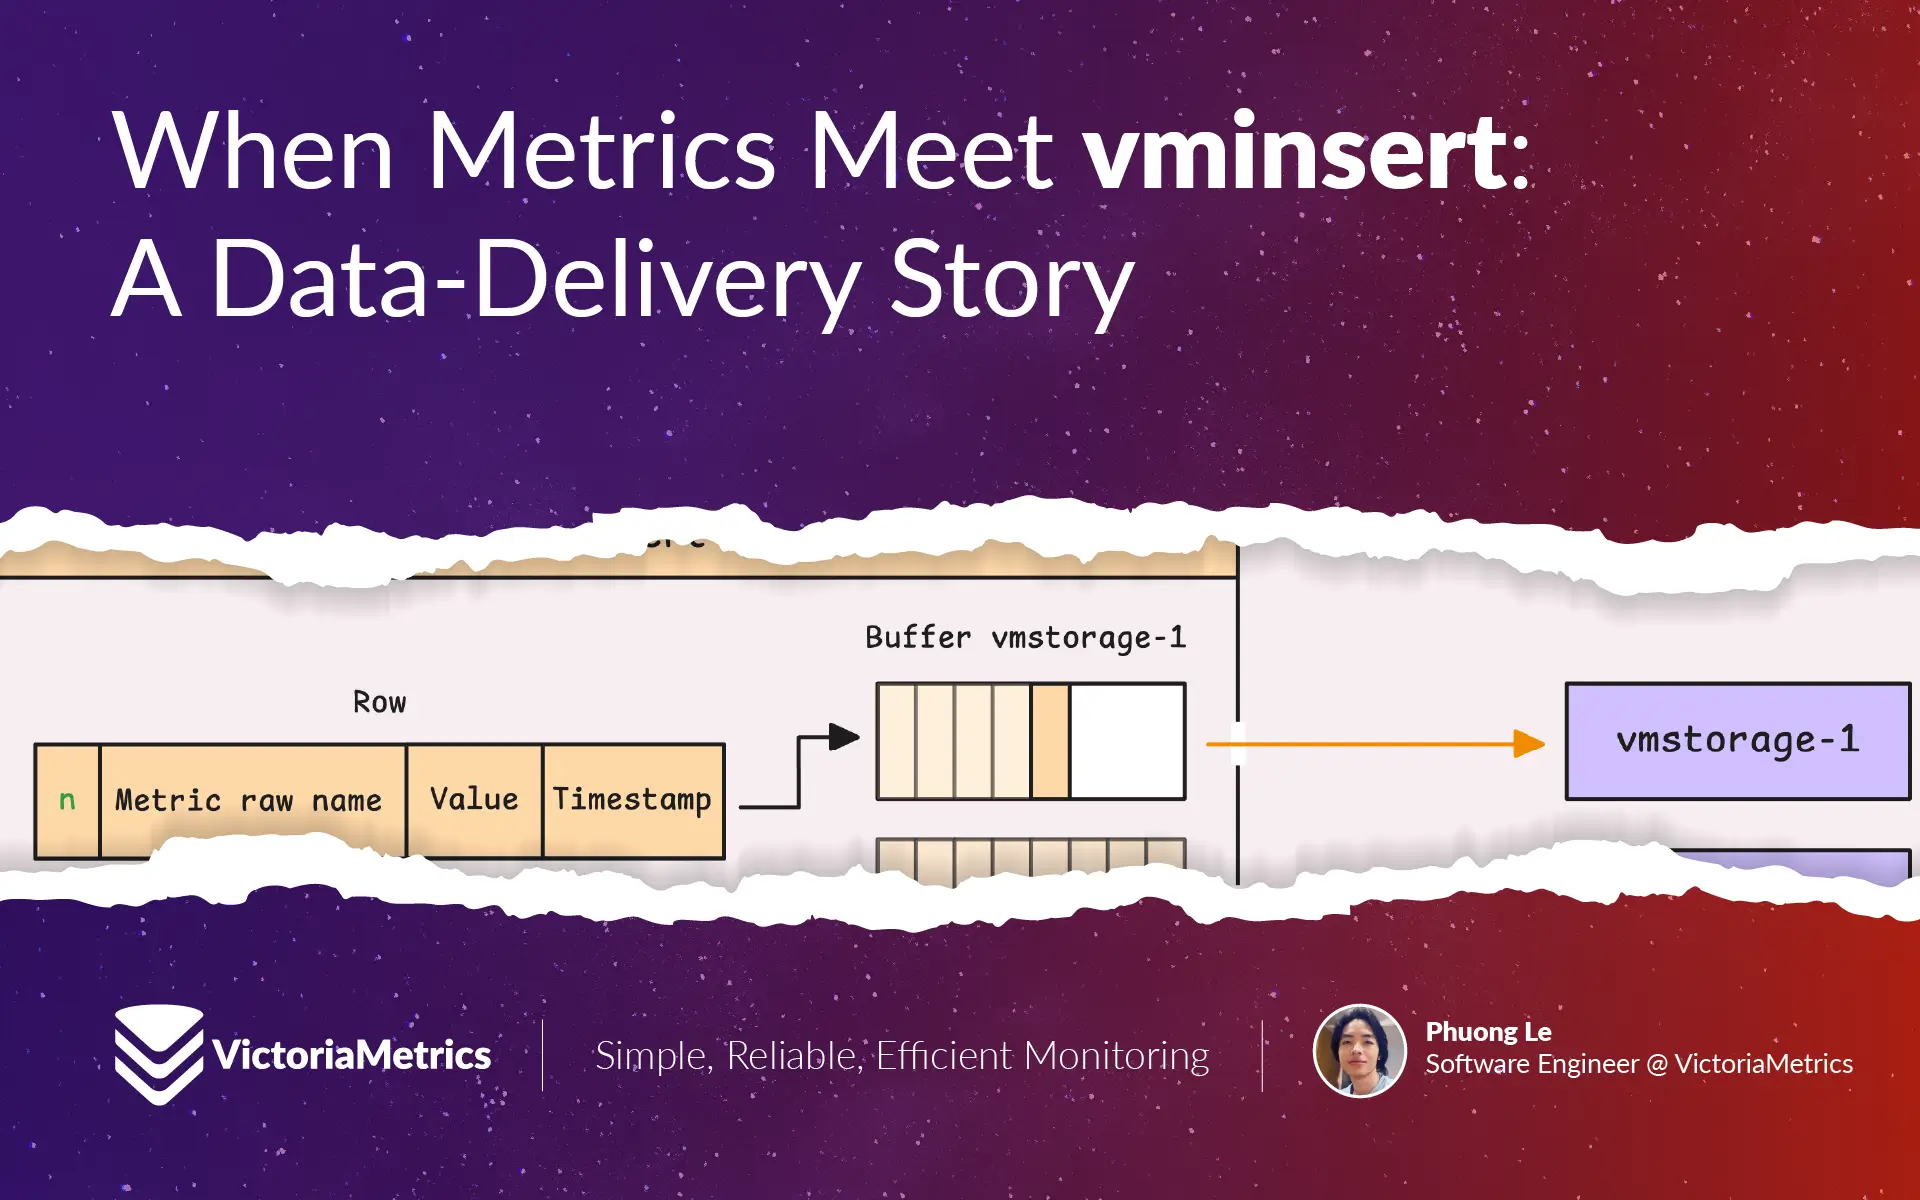
When Metrics Meet vminsert: A Data-Delivery Story
vminsert acts as a gateway for incoming monitoring data. It receives data in different formats, processes it by parsing and adjusting labels, then uses memory buffers to send this data to storage nodes. It’s smart enough to always send the same type of data to the same storage node and can redirect data if a node isn’t working properly.
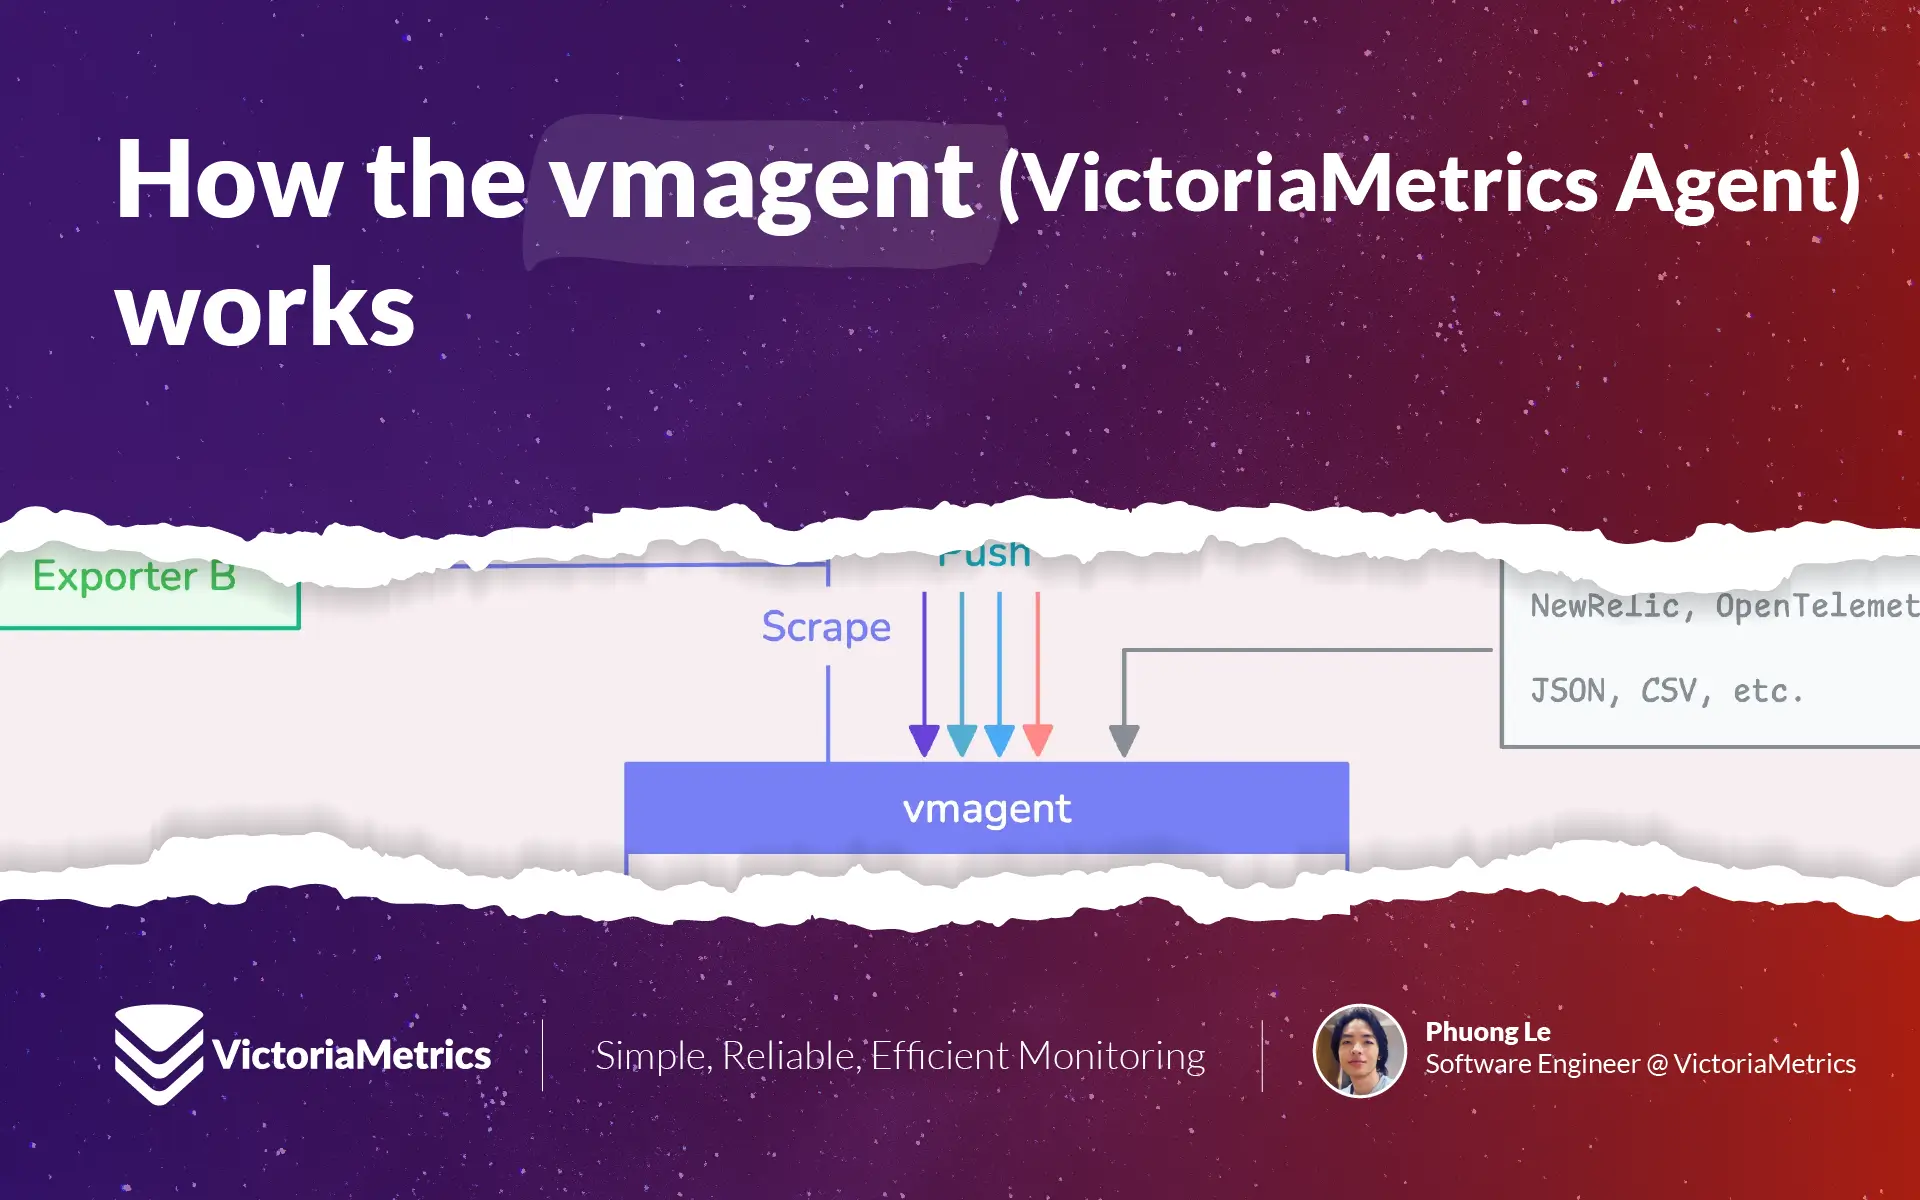
How vmagent Collects and Ships Metrics Fast with Aggregation, Deduplication, and More
VictoriaMetrics agent, or vmagent, is a lightweight tool designed to gather metrics from a number of different sources. Once it pulls in all those metrics, vmagent lets you ‘design’ them (through ‘relabeling’) or filter them down (doing things like reducing cardinality, stream aggregation, deduplication, and so on) before shipping them off to wherever you want to store them.
VictoriaMetrics Anomaly Detection: What's New in Q3 2024?
Explore the latest improvements in VictoriaMetrics Anomaly Detection (vmanomaly), including optimizations, online models, multitenantcy and mTLS support.
Monitoring Azure AKS & Azure Linux with VictoriaMetrics
Learn how to monitor Azure AKS and Azure Linux with VictoriaMetrics. This blog post covers the setup process for environments with high security requirements and how to monitor them with VictoriaMetrics.
The Rise of Open Source Time Series Databases
Time series databases are essential tools in any software engineer’s toolbelt. Their development has been shaped by user needs and countless open source contributors, leading to the healthy ecosystem of options we see today. In this article, you’ll see how time series databases came about, and why so many are open source.
Community Question: High Churn Rate Without New Time Series?