From the article
Monitoring - Insights from VictoriaMetrics
Author
- Adam Yates
- Aditya Kulkarni
- Adrian Bridgwater
- Agustín Gallego
- Alex Woodie
- Alexander Marshalov
- Aliaksandr Valialkin
- Aman Agarwal
- Antony Savvas
- Artem Navoiev
- Bill Tanner
- Cer6erus
- Claudio Masolo
- David Marshall
- Denys Holius
- Derek Foster
- Diana Todea
- Dima Lazerka
- Dmytro Kozlov
- Emily Foster
- Fintech Herald
- Fred Navruzov
- Gary Flood
- Gonzalo García Labat
- Ivan Yatskevich
- Jaime Hampton
- Jan Sokol
- Jason Bloomberg
- Jason English
- Jean-Jerome Schmidt-Soisson
- Jesús Espino
- Joab Jackson
- John Seekins
- Jose Gomez-Selles
- Julien Menan
- Karan Virdi
- Laveesh Kocher
- Leigh McGowran
- Lindsay Clark
- Marc Sherwood
- Mark Baker
- Martijn Van Best
- Martin Veitch
- Mathias Palmersheim
- Michelle Sebek
- Nick Gibson
- Nikolay Khramchikhin
- Pablo Fernandez
- Phuong Le
- Rafal Szypulka
- Renato Losio
- Richard Speed
- Roman Khavronenko
- Vadim Alekseev
- Vadim Rutkovsky
- Yurii Kravets
- Zakhar Bessarab
- Zhu Jiekun
No matching authors found.
Monitoring
- Benchmark
- Community
- Company News
- Customer Stories
- Developer Experience
- Distributed Tracing
- Events
- Go
- Go @ VictoriaMetrics
- High Cardinality
- Kubernetes
- Monitoring
- Observability
- Open Source Tech
- OpenTelemetry
- OTLP
- Performance
- PostgreSQL
- Product News
- Tech Talk
- Time Series Database
- VictoriaLogs
- VictoriaMetrics
- VictoriaTraces
No matching categories found.
Filter: Monitoring
Blog posts
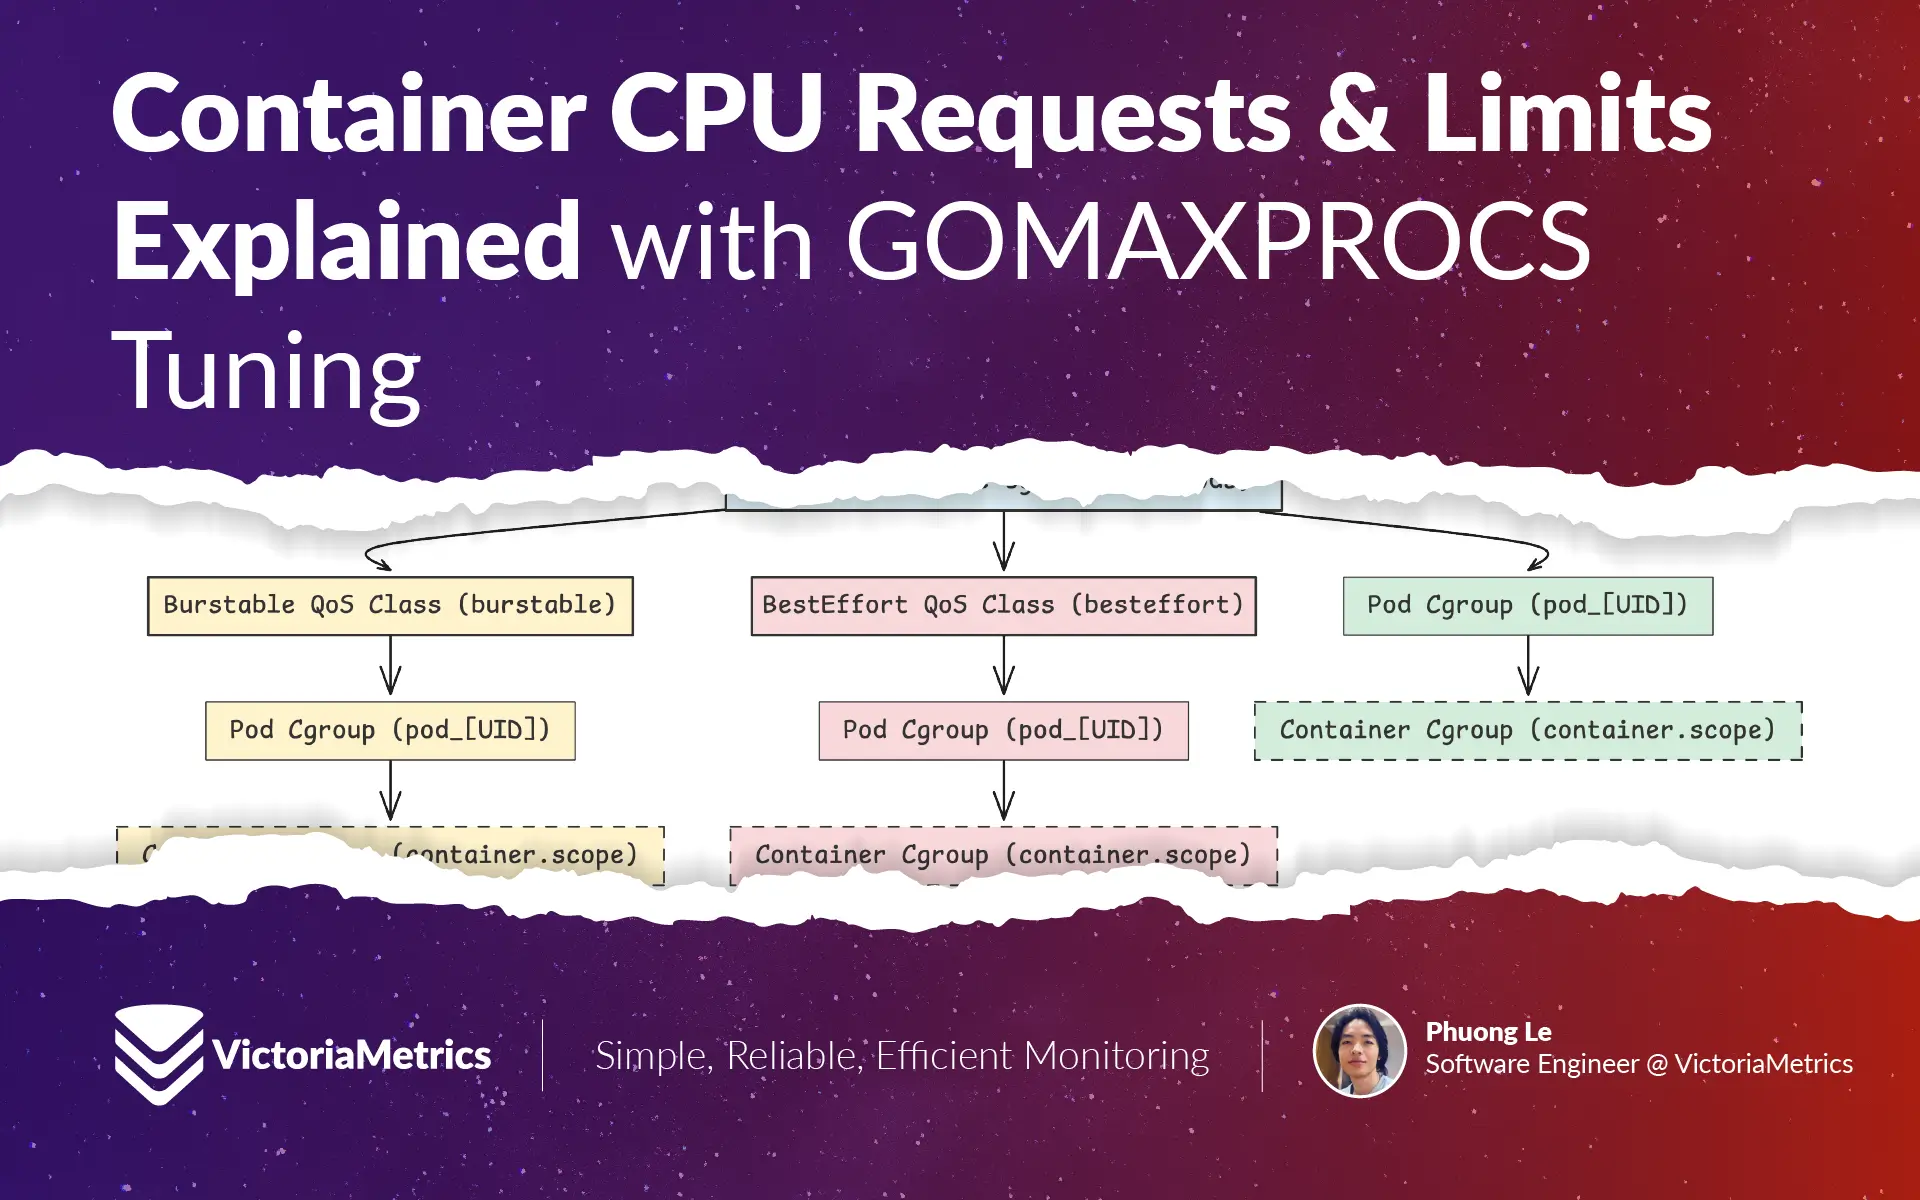
Container CPU Requests & Limits Explained with GOMAXPROCS Tuning
When running Go apps in Kubernetes, default CPU thread scheduling can conflict with cgroup CPU limits. The runtime sees all host CPUs, but the container may only be allowed a fraction of one. This often leads to early throttling. Properly configuring GOMAXPROCS avoids this waste and improves stability.
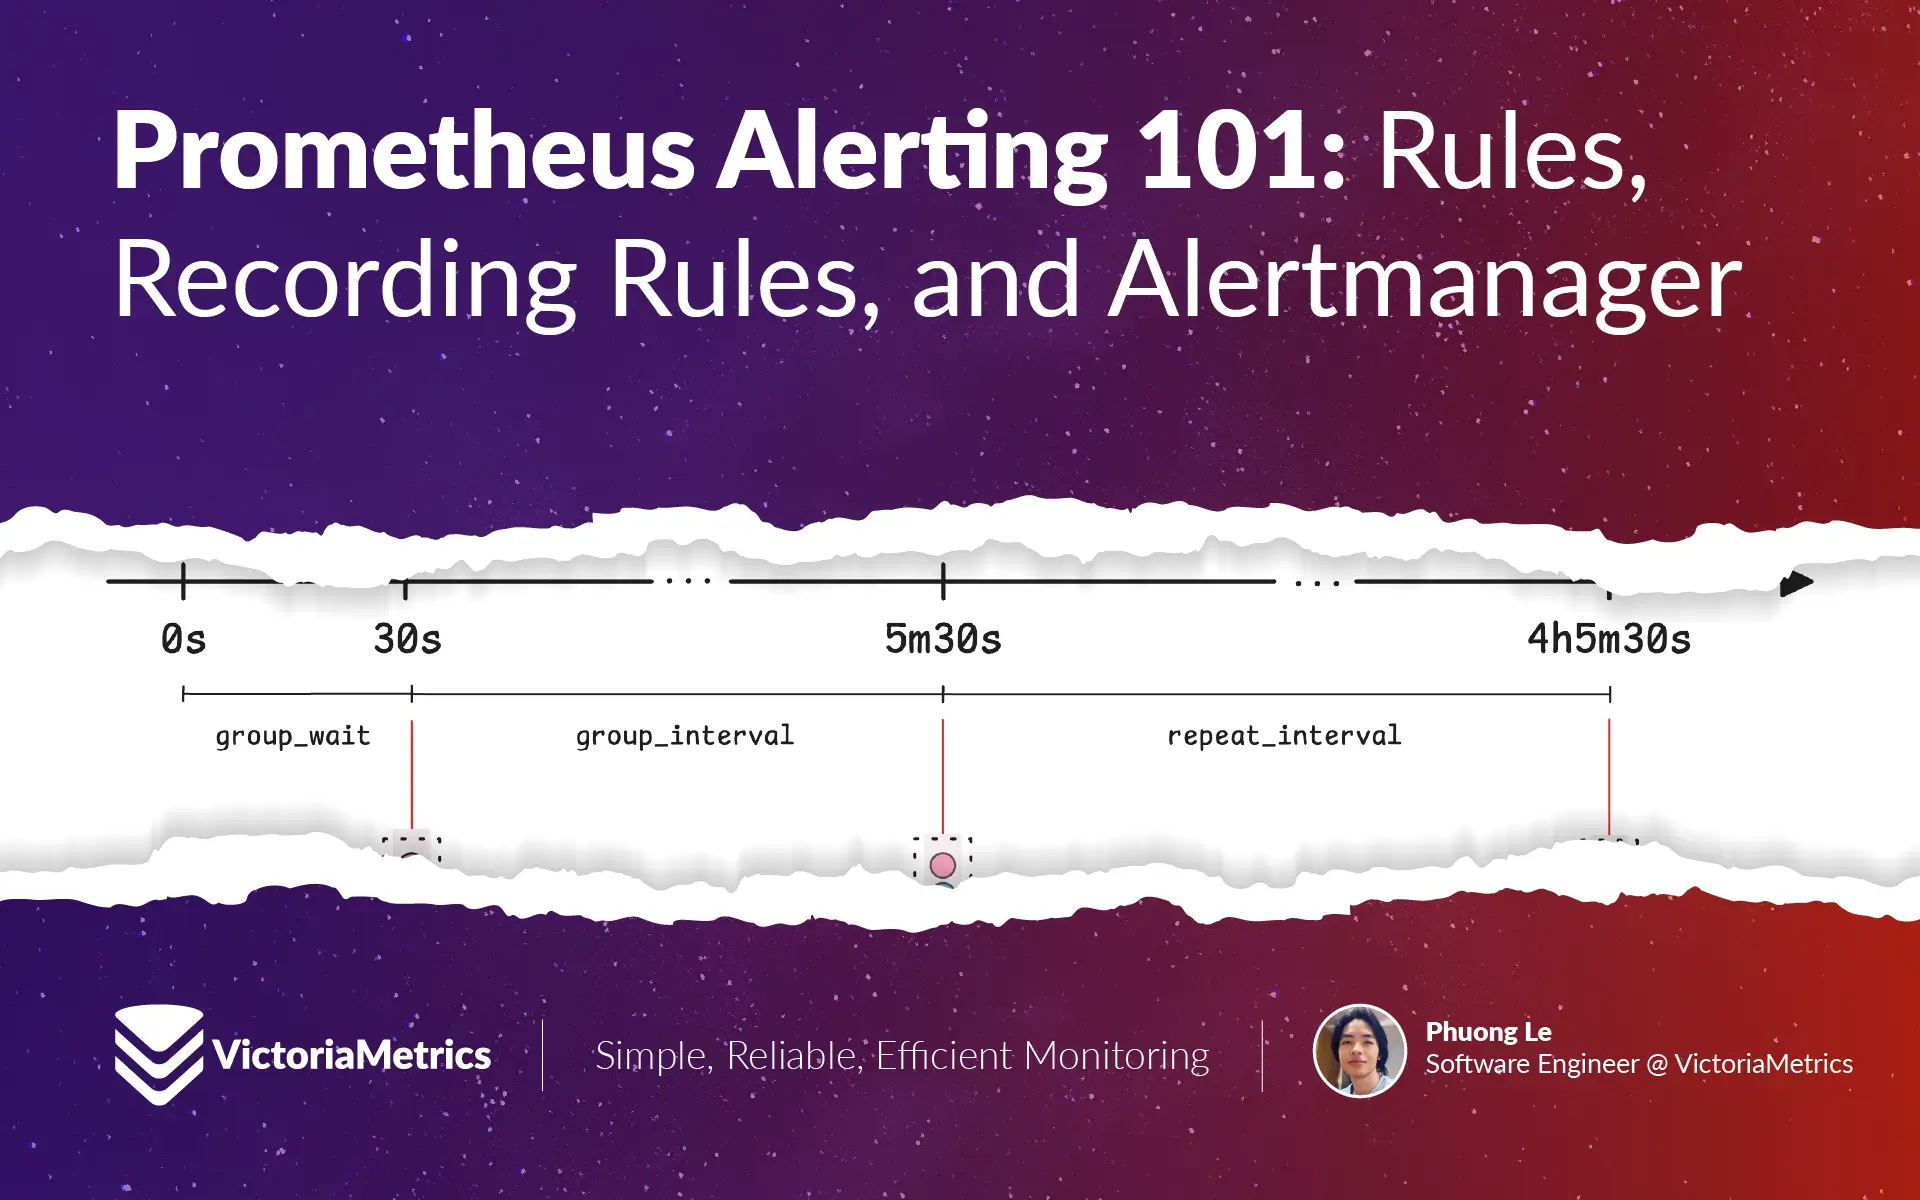
Prometheus Alerting 101: Rules, Recording Rules, and Alertmanager
Recording rules can transform complex PromQL queries into pre-computed metrics, eliminating repeated calculation overhead. When organized in groups, these alerting and recording rules can be precisely scheduled to run at specific times like 01:30, 02:30, and even execute in parallel for maximum efficiency.
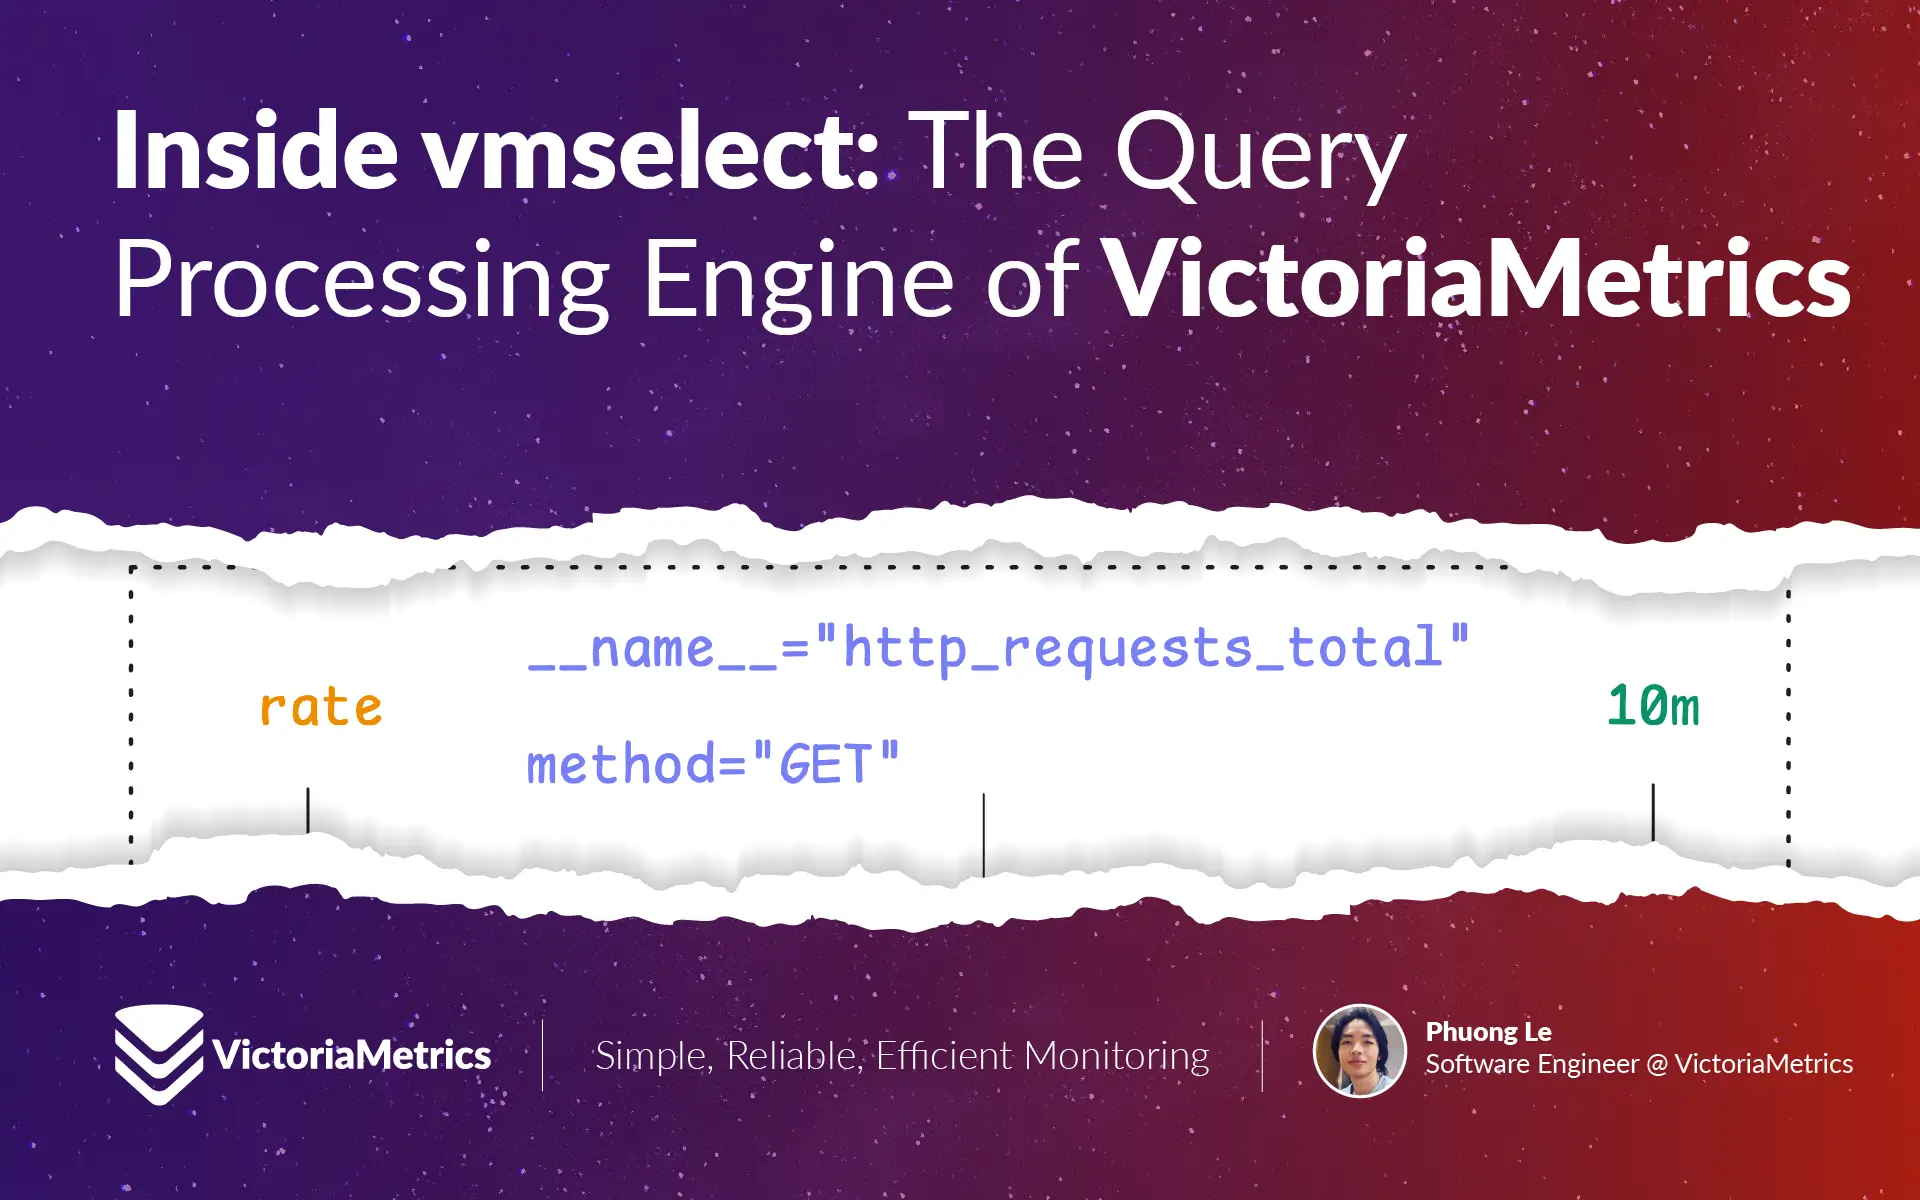
Inside vmselect: The Query Processing Engine of VictoriaMetrics
The article explains vmselect’s core functionalities: concurrent request processing, query parsing and validation, data fetching and merging from vmstorage nodes, and memory-efficient result caching.
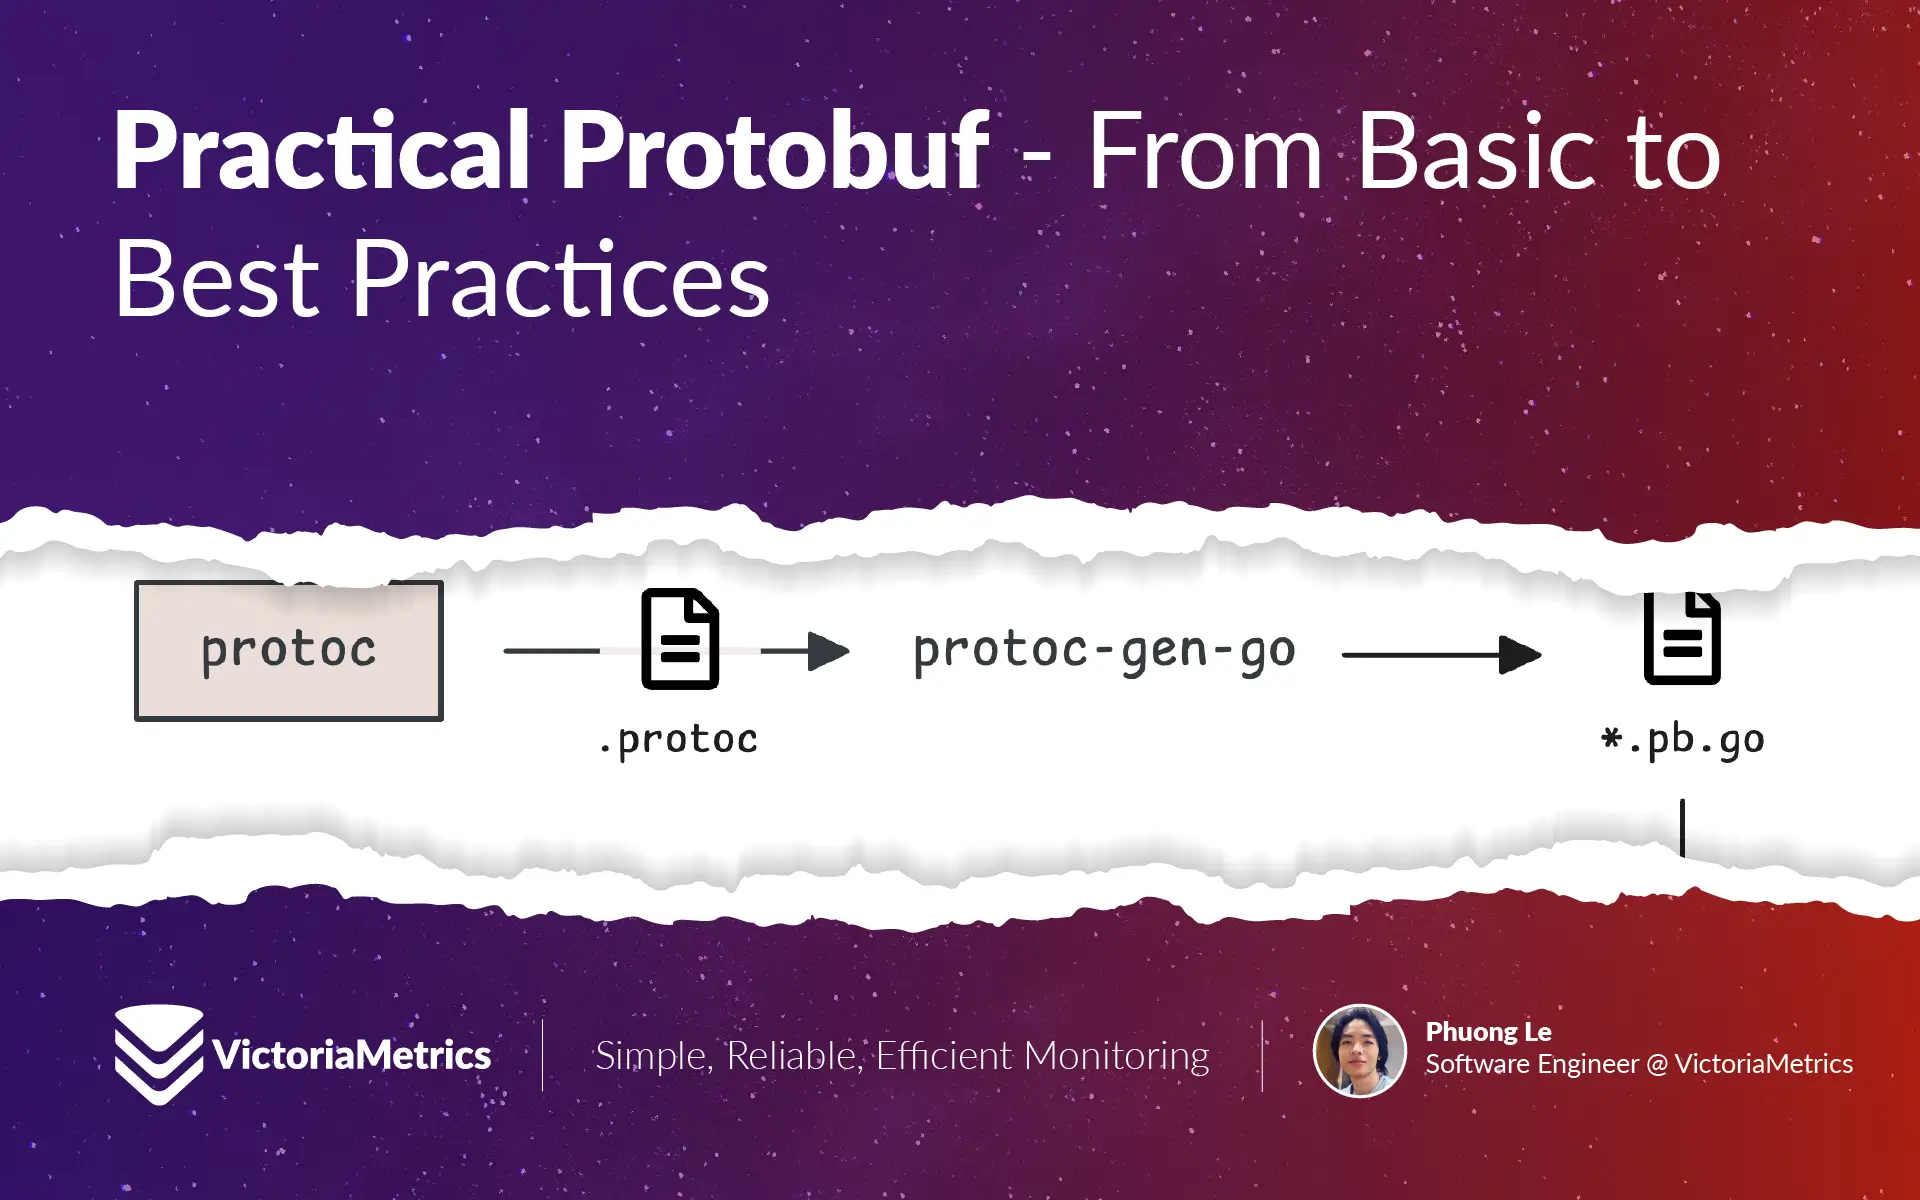
Practical Protobuf - From Basic to Best Practices
Different Protobuf types dramatically impact your binary size—sint32 encoding needs just 1 byte for negative numbers while int32 wastes 10 bytes, repeated fields can balloon with large tag numbers, and poor type choices can triple your network traffic. Learn the exact patterns to optimize your Protobuf messages for production.
Prometheus Monitoring: Instant Queries and Range Queries Explained
When evaluating, instant vectors provide current snapshots, while range vectors give you multiple values over a period of time. But how do they work?
Prometheus Metrics Explained: Counters, Gauges, Histograms & Summaries
Metrics come in different types: counters that only increase, gauges that fluctuate, histograms that show value distributions, and summaries that pre-calculate statistics.

FOSDEM 2025 recap
FOSDEM (Free and Open Source Software Developers’ European Meeting) is a huge, free, gathering for open-source software enthusiasts that happens every February in Brussels, Belgium. It’s a non-profit event put together by the community, and it’s one of the biggest of its kind. See more in our recap!
OpenTelemetry, Prometheus, and More: Which Is Better for Metrics Collection and Propagation?
OpenTelemetry, Prometheus 2.x, Prometheus 3.x, and vmagent are put together for comparison in scraping and pushing data to remote storage.
How vmstorage Handles Query Requests From vmselect
When vmselect asks vmstorage for data, there’s actually quite a bit happening behind the scenes. This article breaks down the process of how vmstorage locates and retrieves your metrics, from finding the right TSIDs to sending back the actual data points.