- Blog /
- Cardinality explorer
Cardinality explorer
Share:


In monitoring, the term cardinality defines the number of unique time series stored in a time series database (TSDB). The higher the cardinality, the more resources are usually required for metrics processing and querying. For example VictoriaMetrics single version needs 850MB RAM for 1 million unique time series and 4GB for 10 million series, but InfluxDB RAM needs 5GB for 1 million unique time series and reaches 9GB for 4 million unique time series, Prometheus starts from 6.5GB and stabilizes at 14GB, respectively. Besides memory, cardinality affects CPU usage, latency of executing queries, and data compression on disk, which may significantly increase the cost of running a TSDB or a monitoring solution.
Time series and metrics
#
TSDBs like VictoriaMetrics or Prometheus share very similar data models. It consists of metrics, time series, and
samples. A metric is a numeric measure or
observation of something. For example, we can measure how many requests users make via metric http_request_total.
We use labels to add some additional information, like which instance handles this request or which path was requested.
A combination of a metric name and its labels defines a time series:
http_request_total{instance=’1’, path=’/read’}
http_request_total{instance=’1’, path=’/write’}
The example above contains two unique time series of the same metric. The number of time series defines the cardinality of the data set.
See more information about VictoriaMetrics data model in Key Concepts.
High cardinality
#
The term high cardinality is used to define some number of unique time series, which may become
concerning for TSDB’s performance. Different TSDBs have different ways of dealing with it, but it is still very
important to keep cardinality under control.
For example, our metric http_request_total has the cardinality=2 so far. But if we decide to collect it from many
instances, let’s say 3, cardinality jumps to 6 = 2 unique path labels * 3 unique instance labels.
If we wanted to have metric per client, we’d add a client_id label to it. And if we have a 1000 of clients,
cardinality elevates to 6000 = 2 path * 3 instances * 1000 clients. Adding a new path label adds another 3000
cardinality:
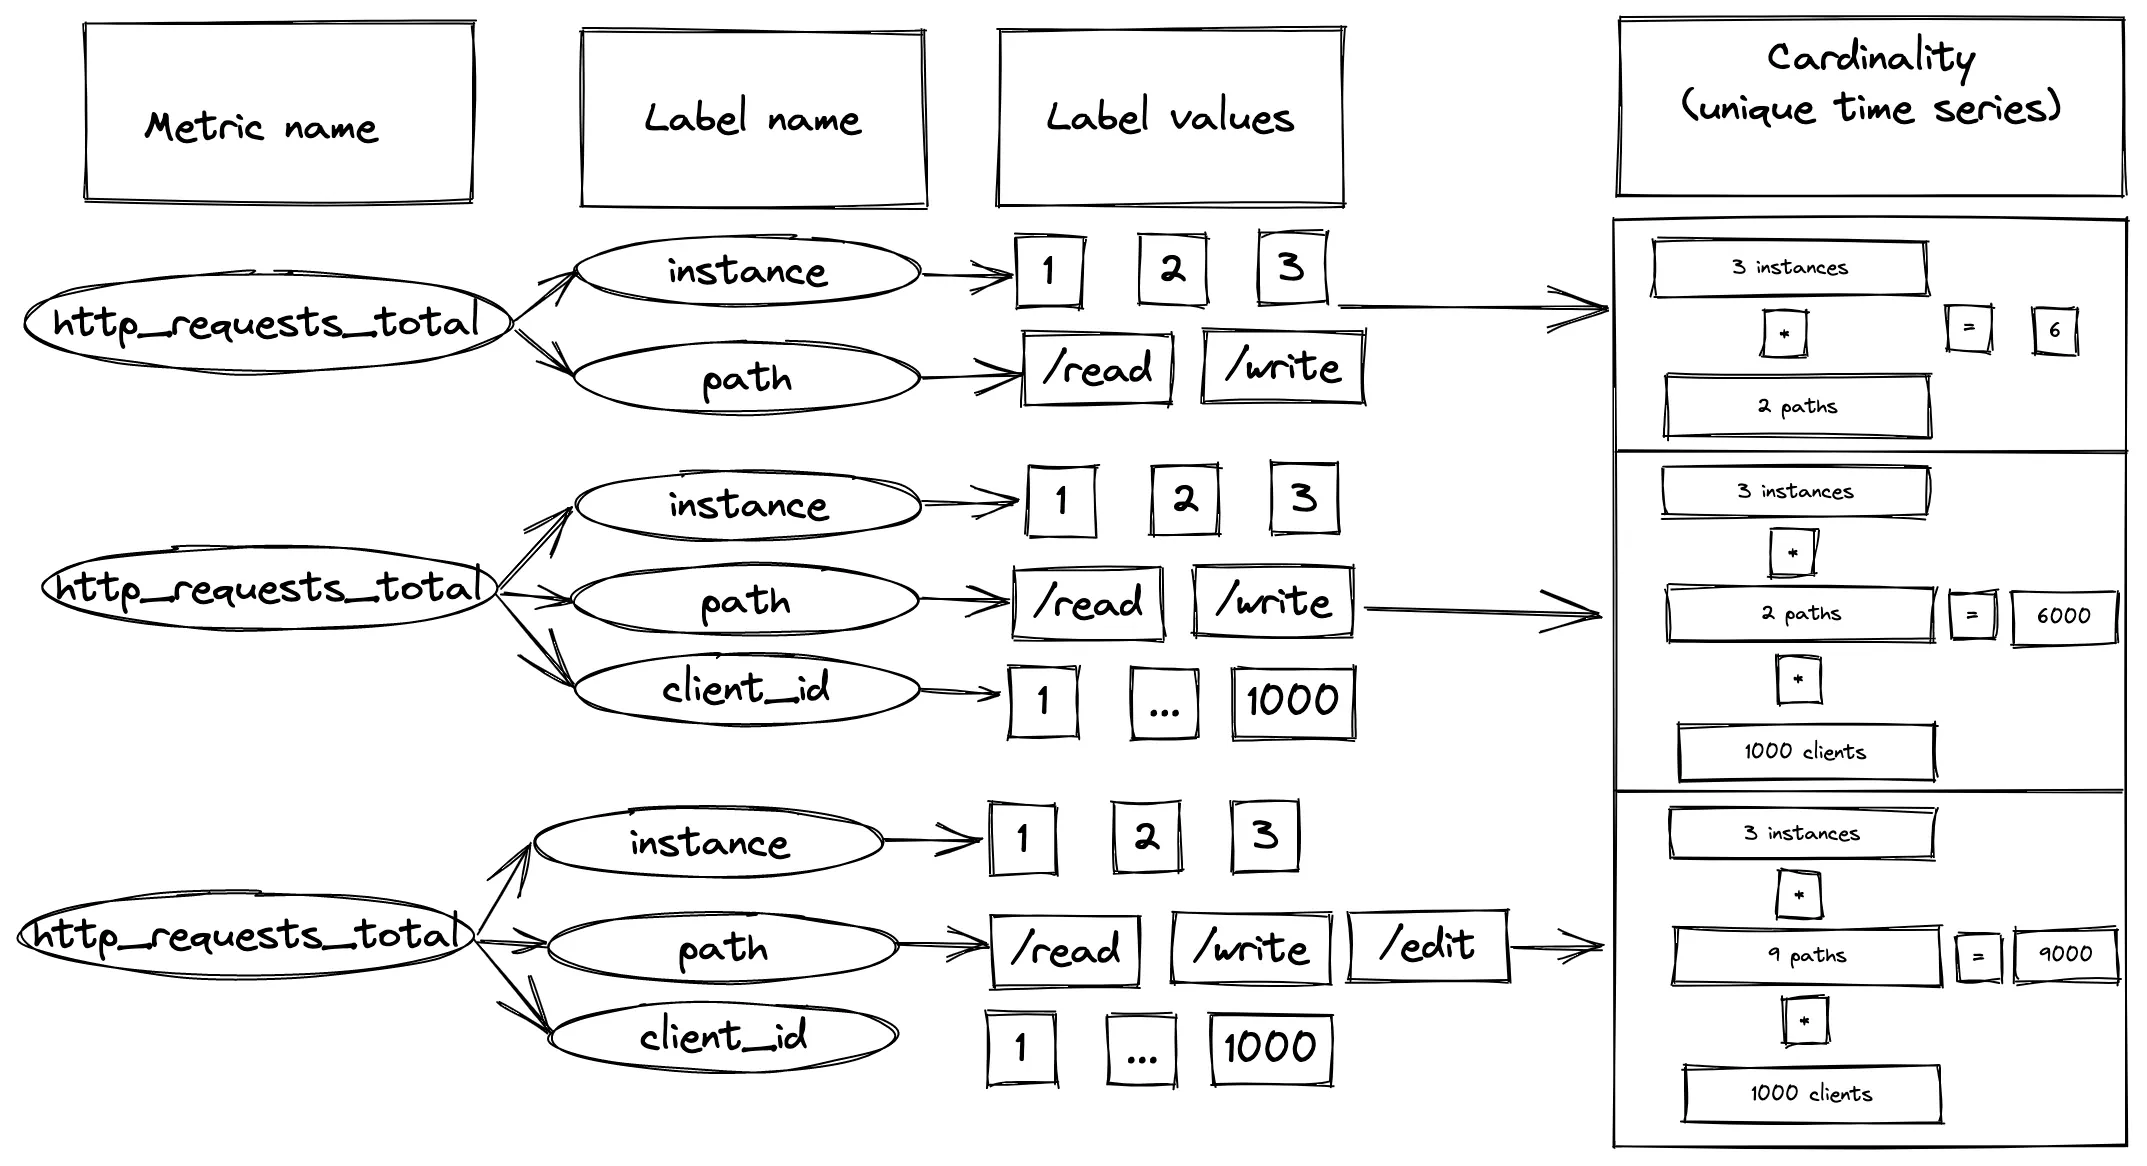 How metric labels contribute into the total cardinality
This is where people start to talk about keeping cardinality under control, because adding one
simple label can multiply the cardinality level.
When we have many label value combination pairs our cardinality grows very quickly.
This situation is especially concerning when you have monitoring solution as a service for different engineering teams.
Each team can ingest arbitrary metrics into it, and a simple mistake in choosing the wrong label can significantly
impact the monitoring platform. This is why it is essentially to have control over cardinality.
How can you explore cardinality in VictoriaMetrics?
#
VictoriaMetrics provides a special tool called cardinality explorer. Cardinality explorer is built on top of the /api/v1/status/tsdb API. Try it on our playground!
In the blogpost, I’m going to analyze our “Sandbox” environment, monitored by VictoriaMetrics cluster. Sandbox runs in Kubernetes cluster and contains various internal services, k8s exporters, node exporter, etc.
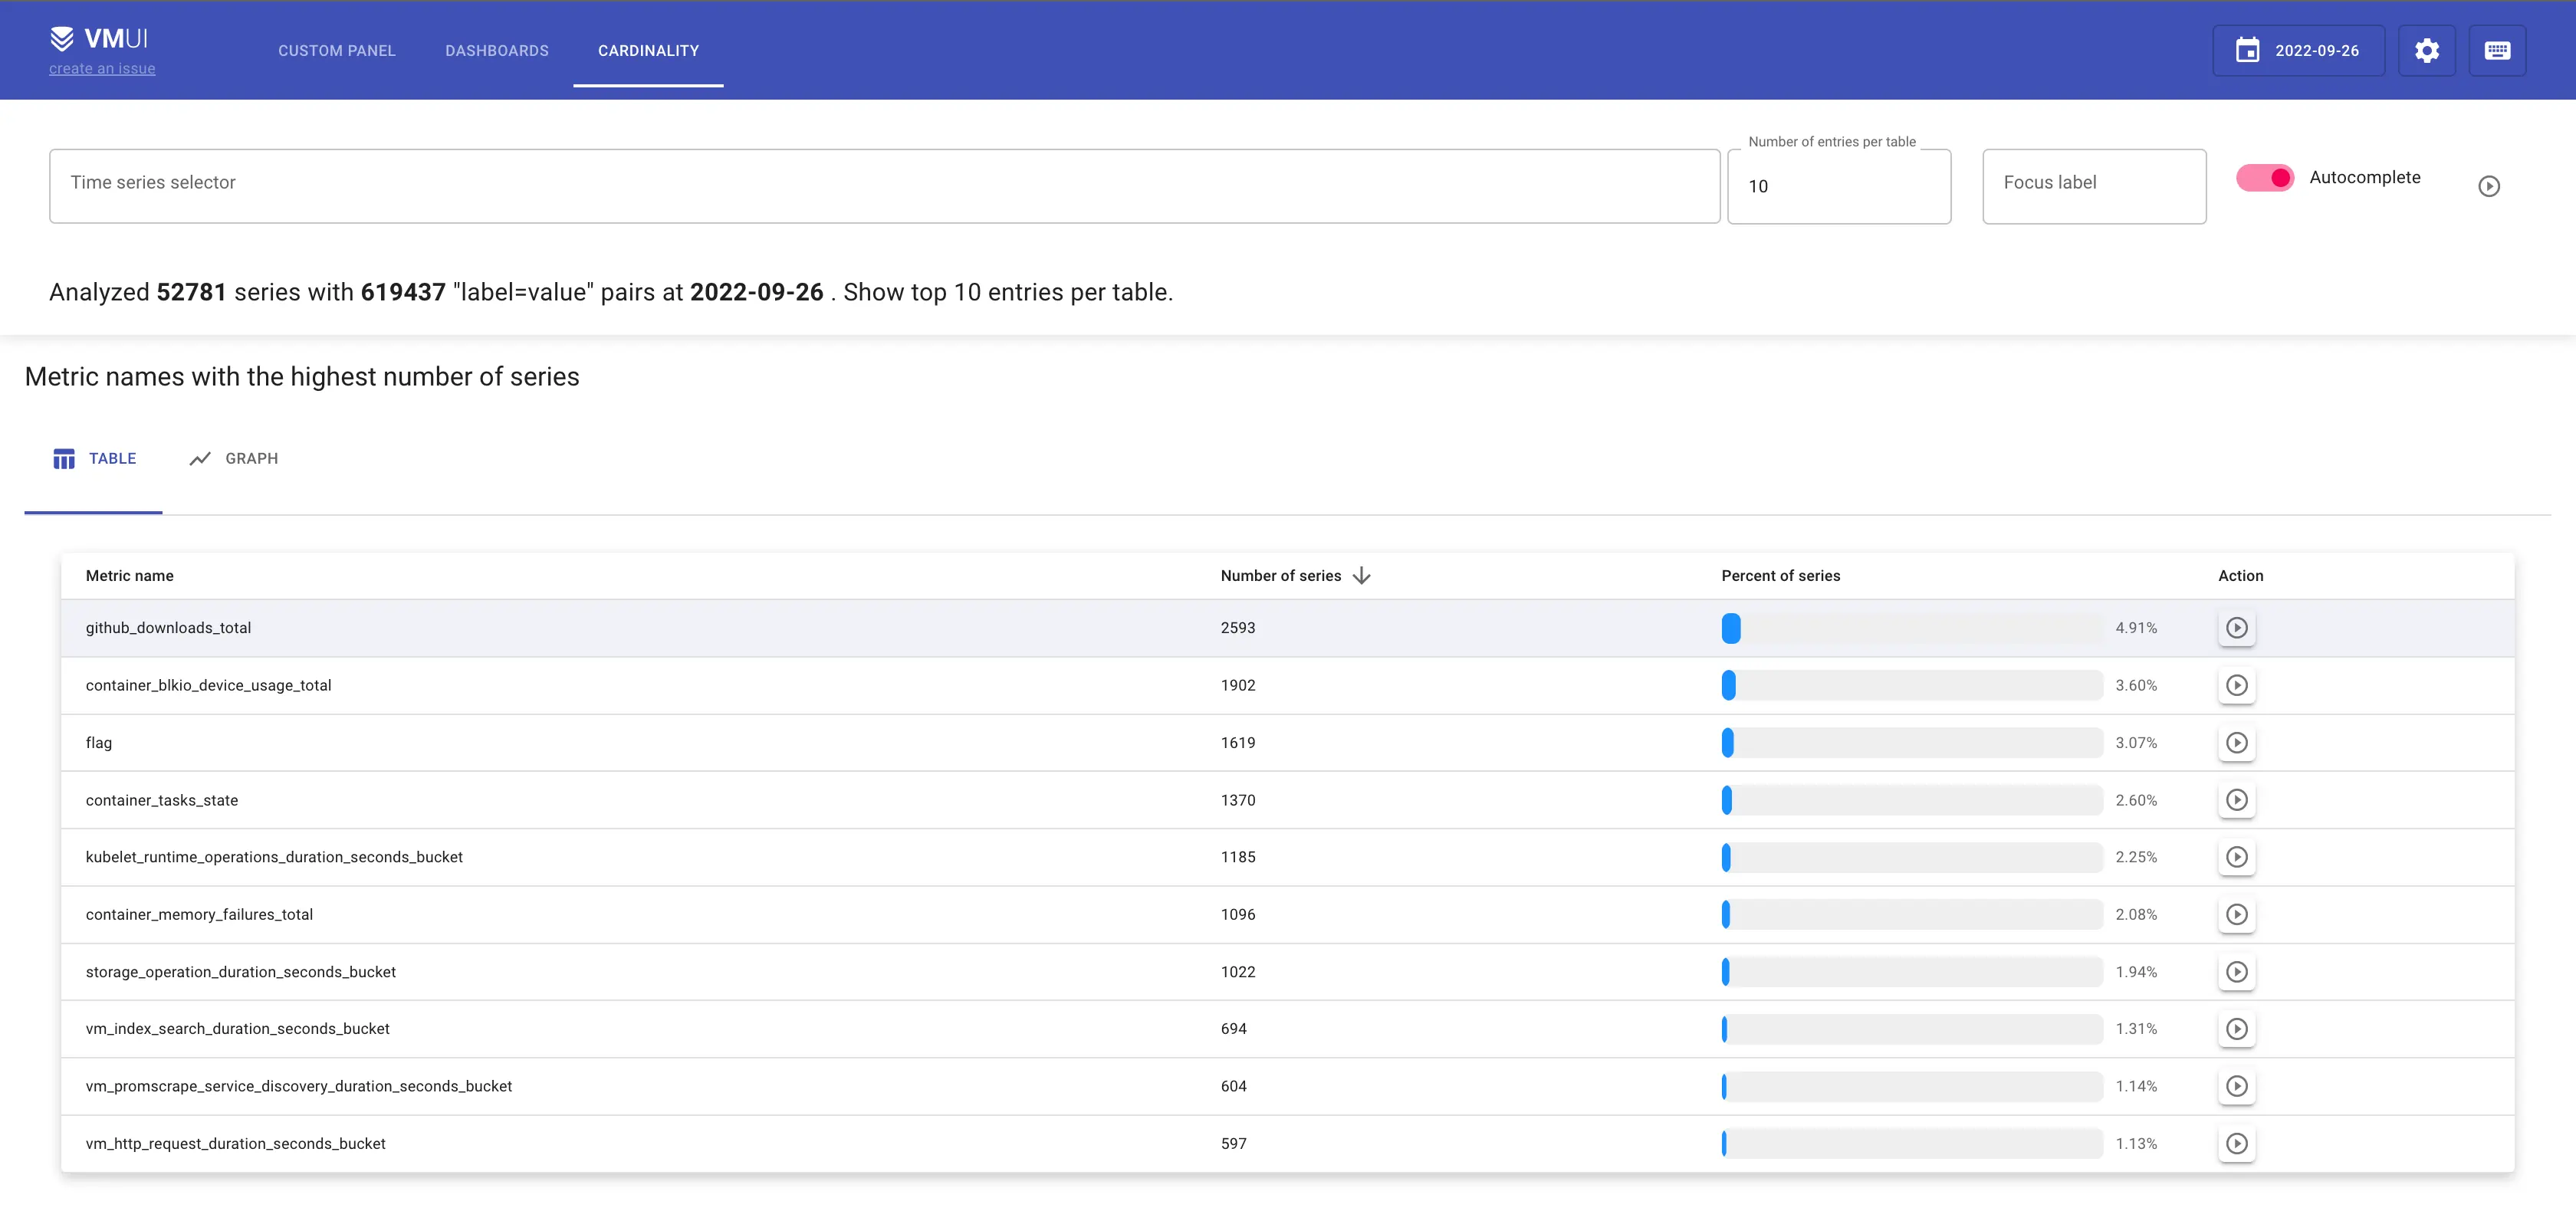
Cardinality explorer view for internal Sandbox cluster in VictoriaMetrics
According to the cardinality explorer screenshot, the top 3 metrics by number of series are:
- github_downloads_total with 2593 unique series;
- container_blkio_device_usage_total with 1902 unique series;
- container_tasks_state with 1370 unique series.
Let’s start the analysis from the metric with the highest cardinality github_downloads_total by clicking on the icon
in Action column:
 Labels with the highest number of series for `github_downloads_total` metric
As in any profiling, always look for outliers. In the screenshot above, all labels are present in the same amount of series, which means the number of labels per series never changes. But let’s check the next section “Labels with the highest number of unique values”.
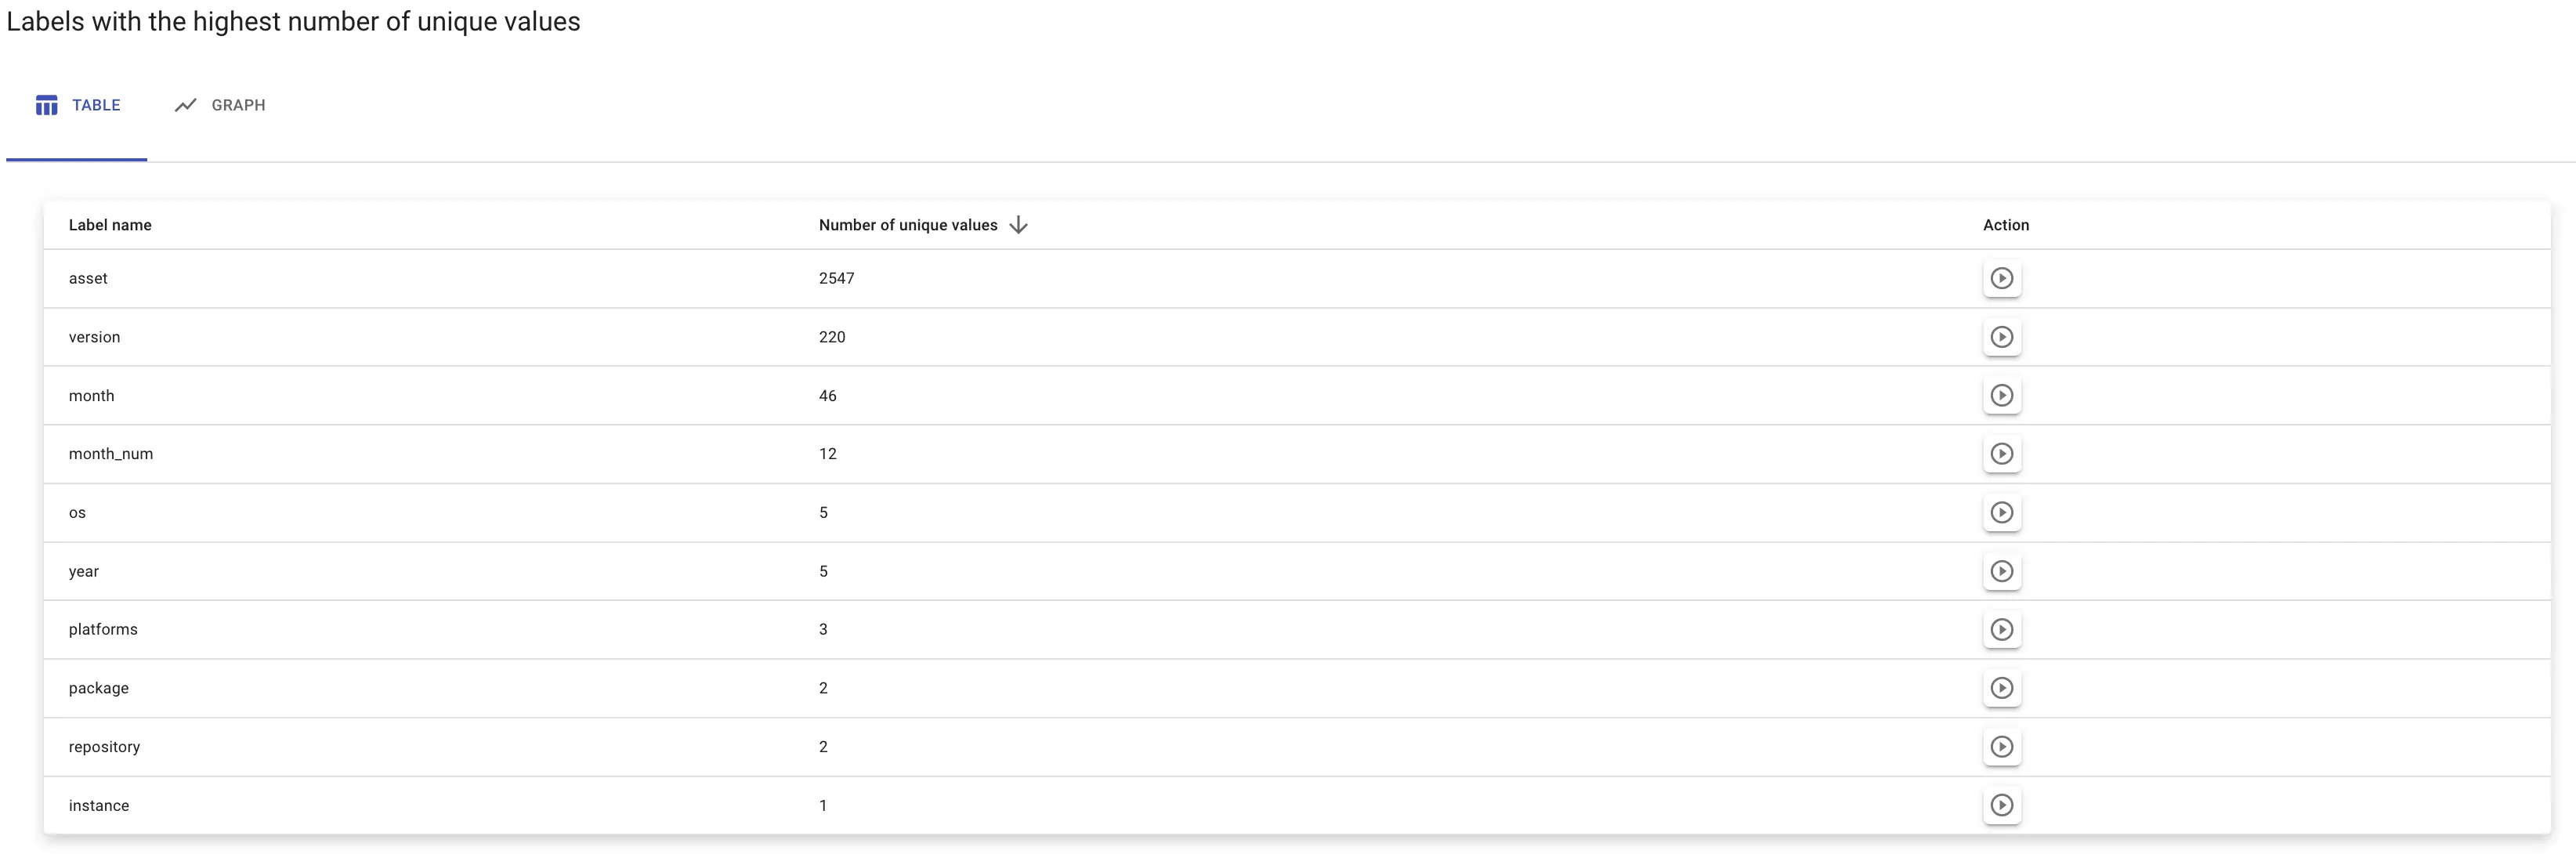 Highest numbers of unique values
Most unique values belong to the label asset. Let’s see what they are by clicking on the icon in Action column:
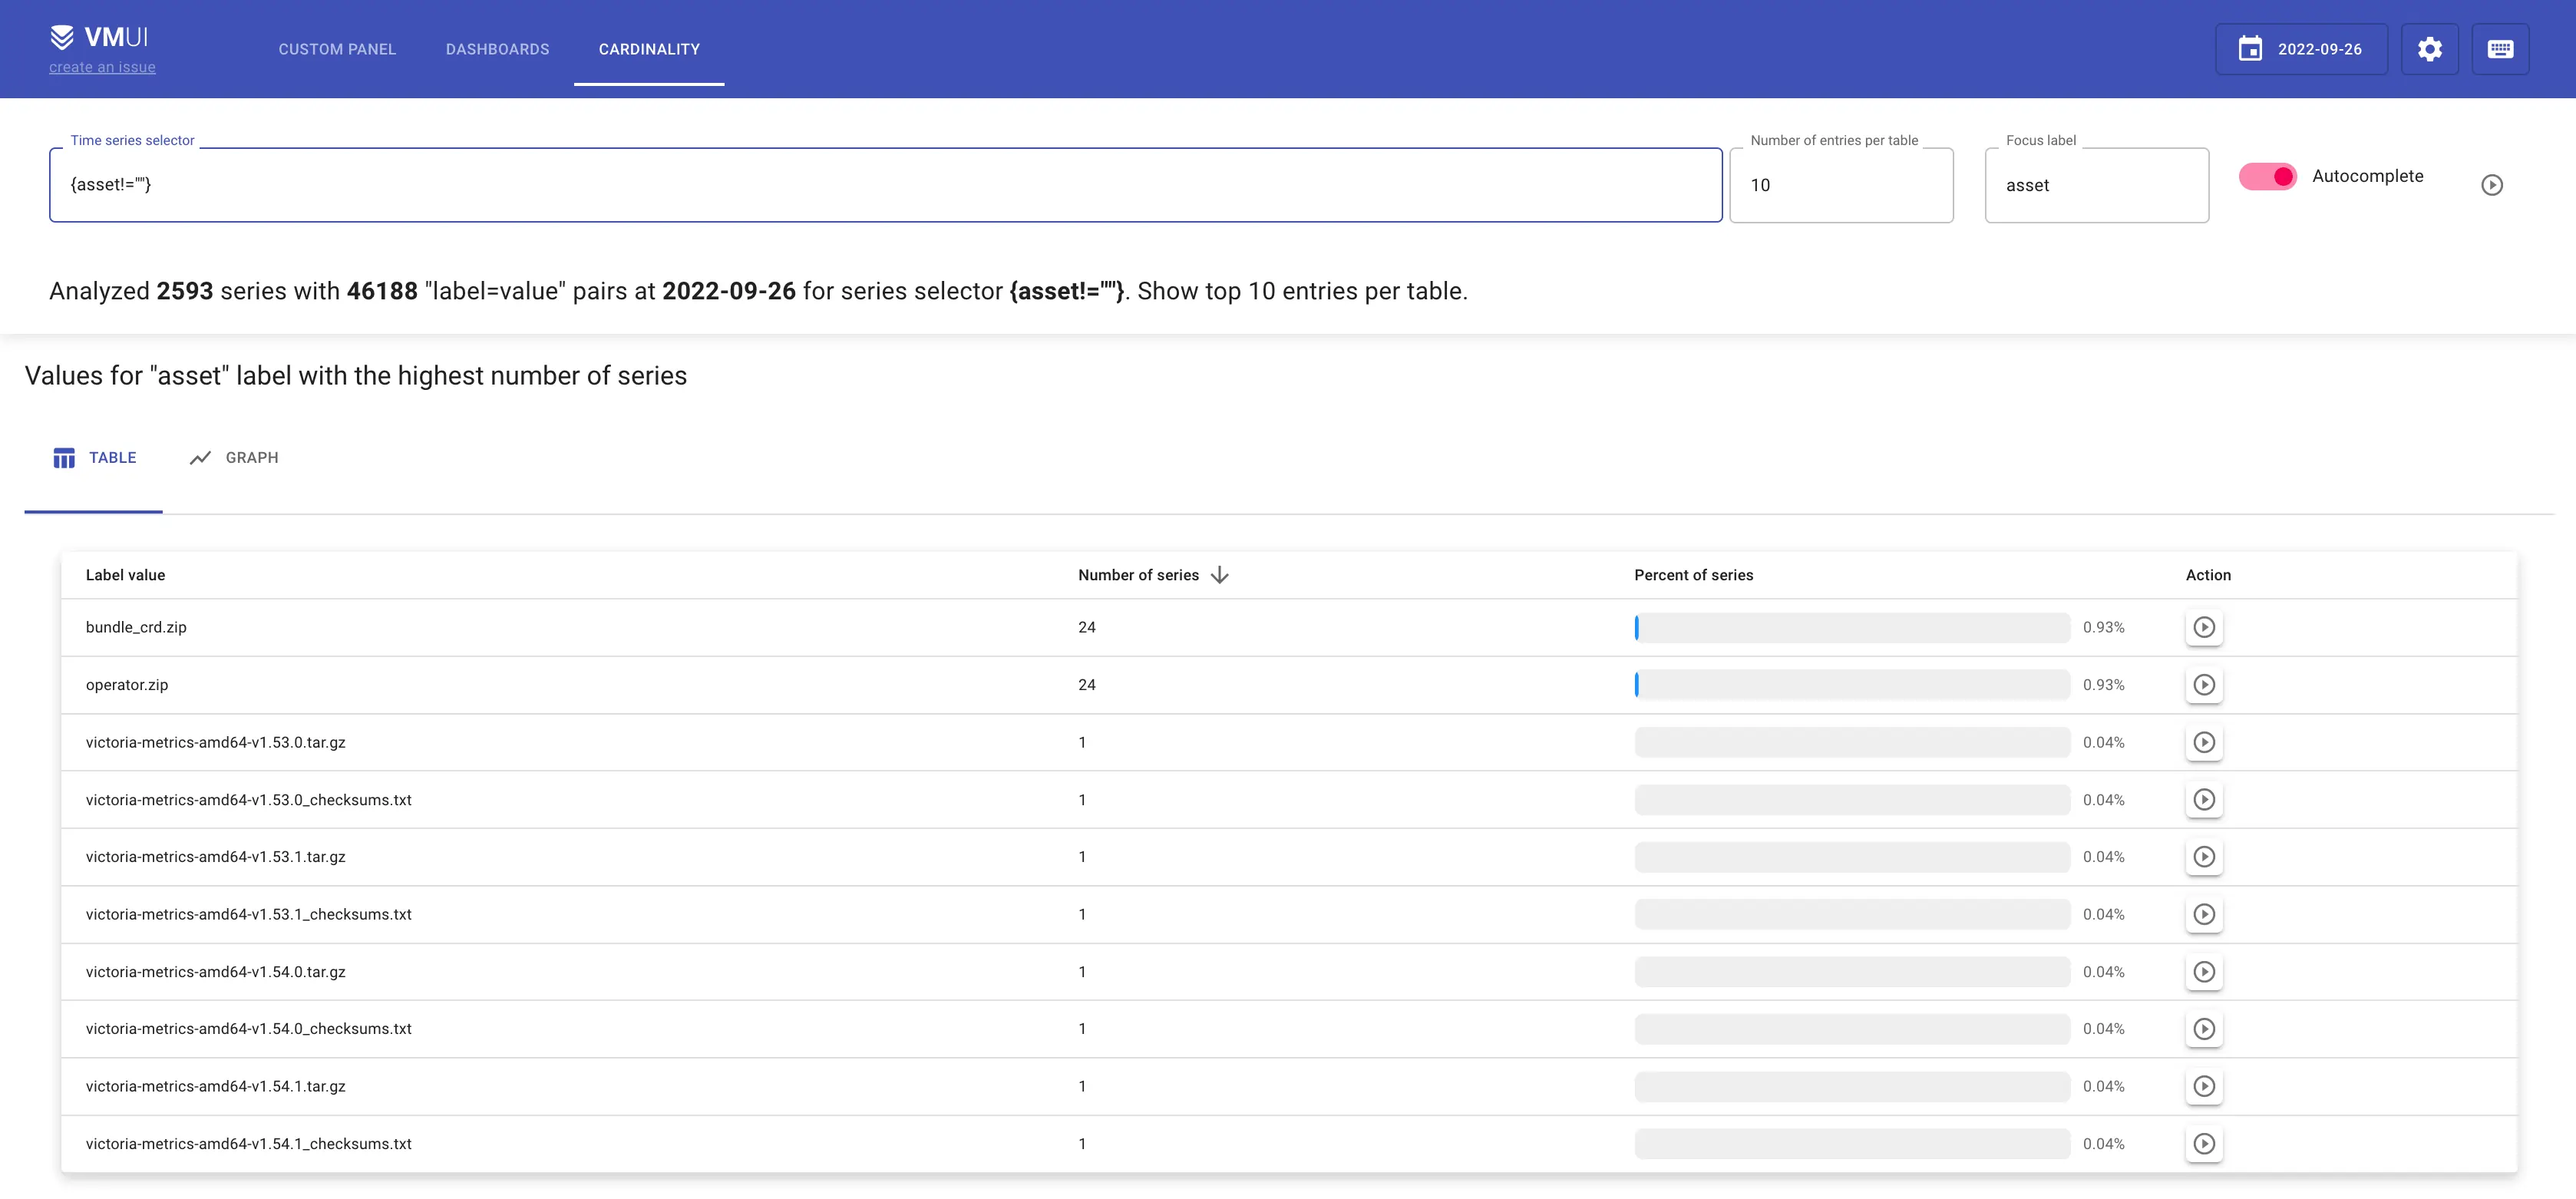 Values for `asset` label with the highest number of series
The screenshot above shows the values for asset label with the highest number of series. The lower is the number of
series, the more unique this value is. So if you’re looking to reduce the cardinality of the metric, look for the lowest
values.
Label asset belongs to our github stats collector. It fetches information about github downloads, so we can know
which release or which platform is the most popular. Turns out, among asset values there are checksum assets
like (victoria-metrics-darwin-amd64-v1.81.2-enterprise_checksums.txt).
Checksum assets are important for users, but not for our internal stats and metrics. We don’t use them in our Grafana
dashboards or in other statistic reports. Let’s filter those assets via regexp {assets~=”.*.txt”}:
 Values for `asset` label
It looks like checksum assets are producing about 1207 series, which is roughly 50% of all time series in github_downloads_total metric. And removing these series is the right thing to do since we have no use for them.
The other metrics from our top-3 list aren’t used as well, so I decided to remove them by updating our relabeling config:
metricRelabelConfigs:
  - source_labels: [ asset ]
    regex: ".*.txt"
    action: drop
  - sourceLabels:
    - __name__
    regex: container_(blkio_device_usage_total|tasks_state)
    action: drop
  - sourceLabels:
    - __name__
    regex: kubelet_runtime_operations_duration_seconds_bucket
    action: drop
We have applied our new relabel config at 18:00. The way it impacts our data you will see on the graph. So what we got:
Decrease of datapoints ingestion rate:
Before we applied relabeling config the ingestion rate was 2.62K, and after it decreased to 2.35K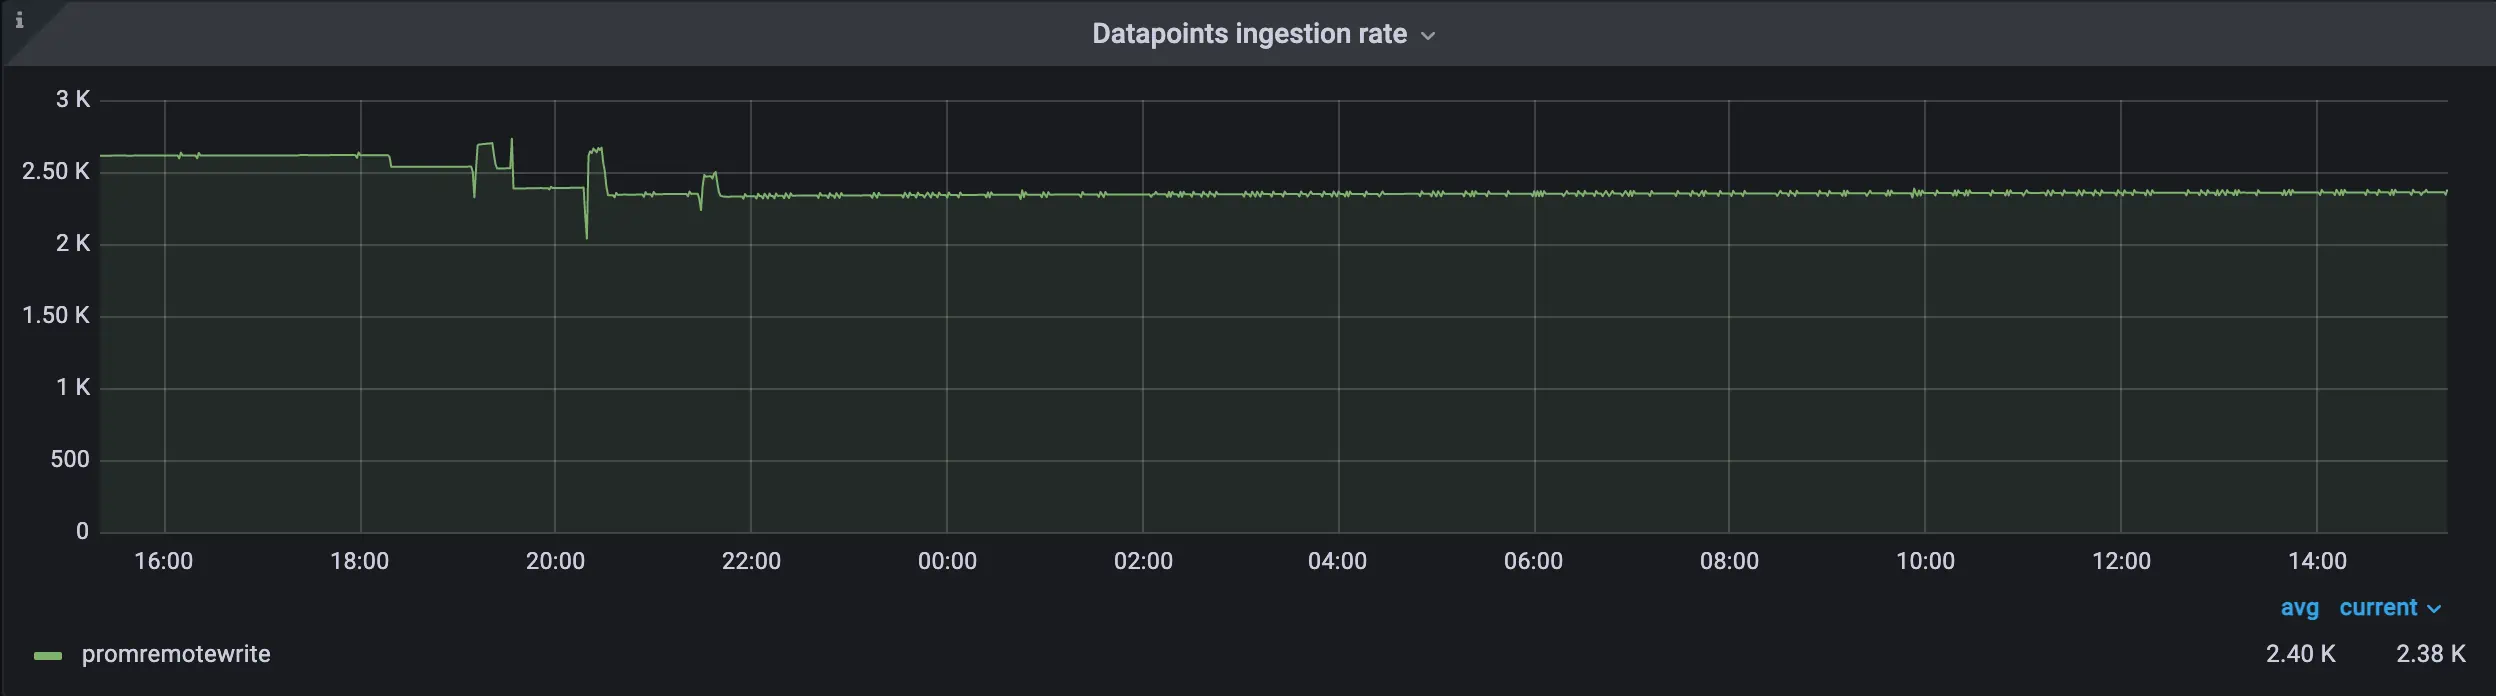 Datapoints ingestion rate after applying relabeling config
Decrease of active time series:
Before we applied relabeling config active time series was 50.5K, and after it decreased to 44.1K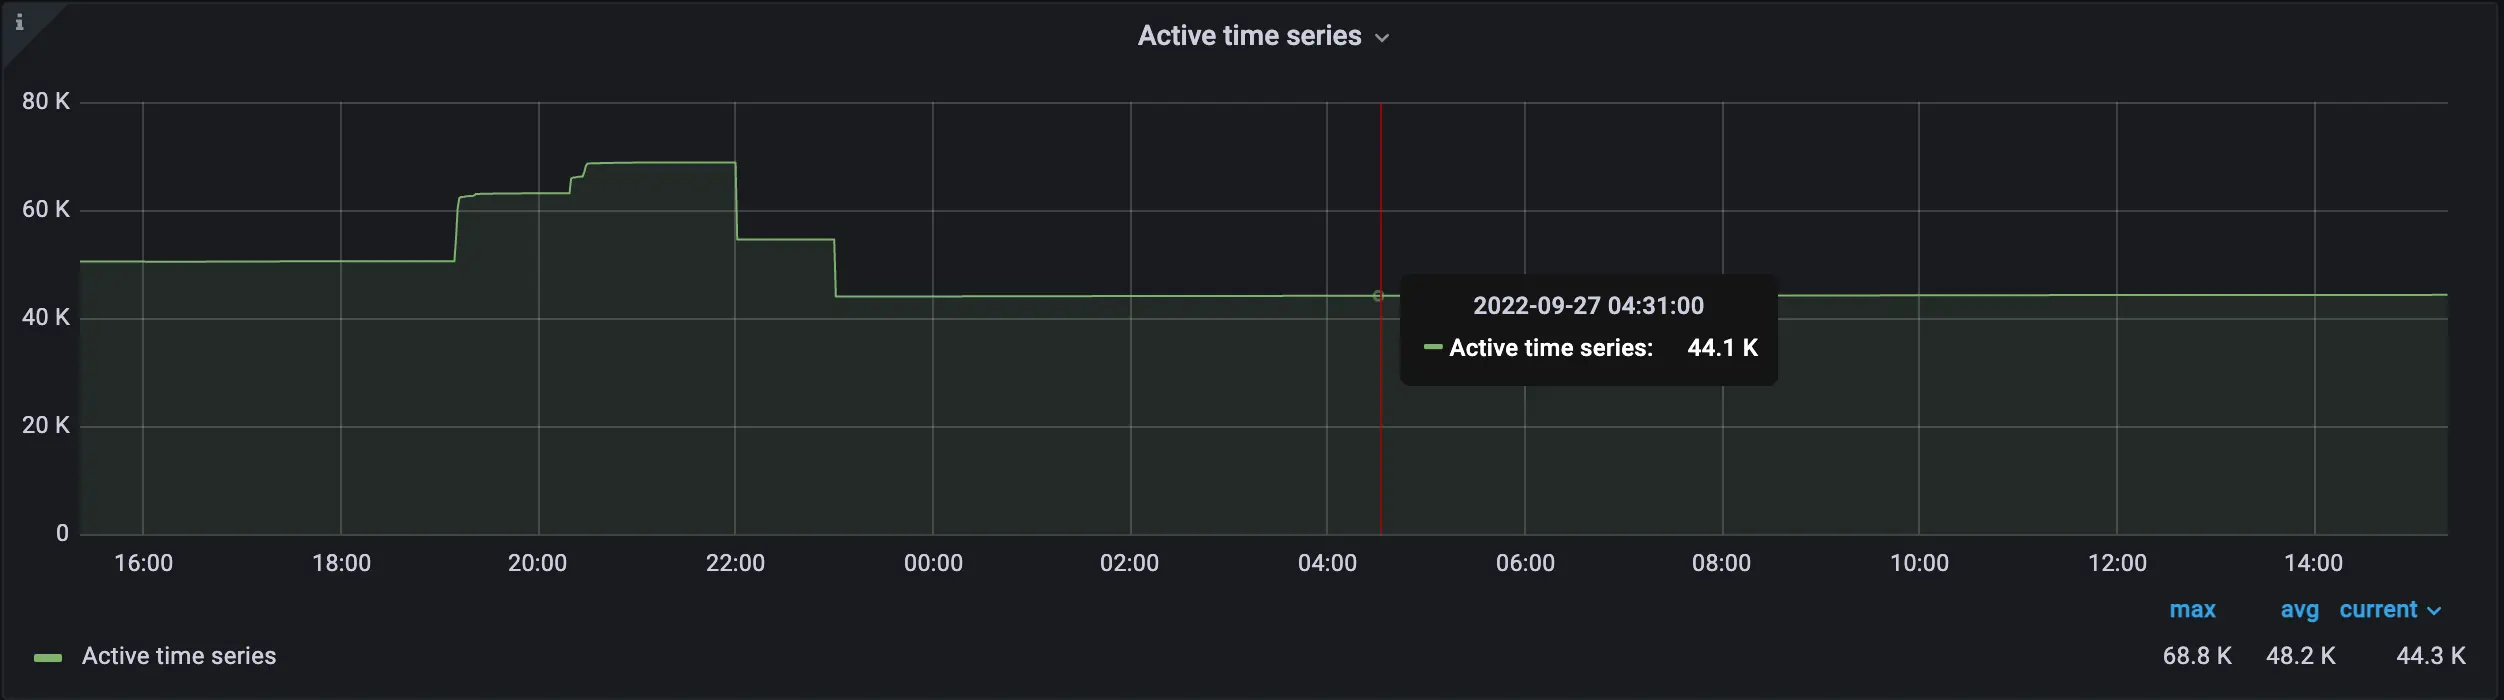 Active time series after applying relabeling config
Increase of storage full ETA (shows the time needed to reach 100% of disk capacity):
The change in amount of inserted data helped us to increase our storage capacity from 26.2 weeks to 28.1 weeks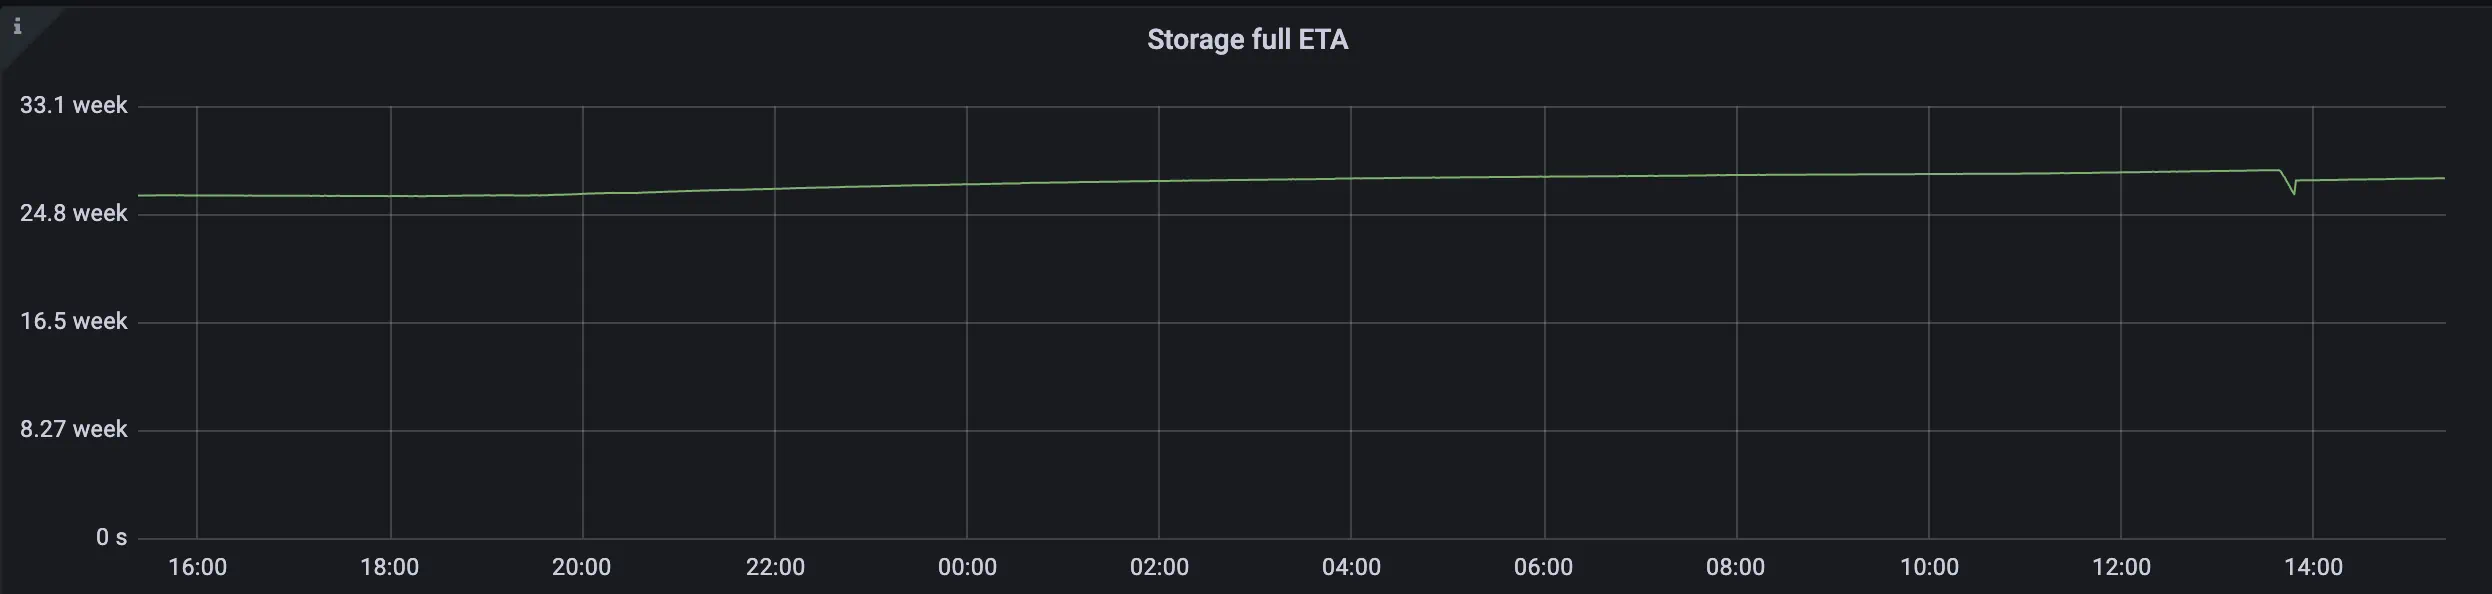 Storage capacity ETA after applying relabeling config
Summary
#
Cardinality explorer is a helpful instrument for analyzing the data of VictoriaMetrics TSDB. It helps to understand which metrics contribute to the cardinality (and so to the resource usage), so user can act accordingly. Always pay attention to the data you write and store. According [to our observations], more than 50% of stored metrics are never used. So having an insight to the stored data and its structure can significantly improve the reliability and resource usage of the monitoring solution.
Leave a comment below or Contact Us if you have any questions!
comments powered by Disqus