- Blog /
- How a US Software Provider Improved Traffic Alerting with VictoriaMetrics Anomaly Detection
How a US Software Provider Improved Traffic Alerting with VictoriaMetrics Anomaly Detection
Share:


Modern infrastructure teams face a common challenge: Traffic patterns that are highly variable, seasonal, and difficult to predict - especially when managing mature products that no longer receive active development. Traditional threshold-based alerting often fails in these environments, producing either blind spots or excessive noise.
Here we share anonymized feedback from one of our enterprise customers, who uses VictoriaMetrics Anomaly Detection (vmanomaly) to monitor traffic across multiple domains. At the customer’s request, identifying details have been omitted. The feedback highlights how fine-tuned anomaly detection helped reduce alert fatigue while improving confidence in incident detection.
Customer Background
#
“I am the Director of IT at an American-based company that provides software and services to personal computer original equipment manufacturers (PC OEMs). We have a number of domains that receive traffic for an established product, which no longer sees active development.”
The customer operates several domains with organic traffic patterns that vary significantly by volume and shape.
The Challenge: Variable Traffic and Alert Fatigue
#
Traffic varies by volume and patterns across domains, which further complicates the effort.
“We don’t want to pay for someone to watch graphs all day, and due to the organic nature of traffic - daily and weekly seasonality and variability across domains - setting static thresholds is a non-starter.”
Previous systems generated frequent false positives. Over time, this resulted in operational noise and declining trust in monitoring signals.
“Automated machine learning solutions from other vendors have just produced noise for us in the past. All this led to, was alert fatigue and decreased confidence in any alerts.”
Why VictoriaMetrics Anomaly Detection
#
The customer adopted VictoriaMetrics Anomaly Detection, using it as a dedicated system for detecting meaningful deviations rather than enforcing rigid thresholds.
“Being able to have a system reliably alert us that there is an actual anomaly with a traffic spike or drop is invaluable, as it frees my team up for other work.”
A key differentiator was the ability to fine-tune models using domain-specific knowledge to accurately reflect different traffic behaviors across domains, including configuring detection direction (spikes versus drops) and previewing alerting rule execution to ensure anomalies must persist before triggering alerts, rather than reacting to transient single-point deviations.
““With VictoriaMetrics Anomaly Detection, we are looking at using different models to match the different patterns.”
Model Tuning, Backtesting, and Visualization
#
After the initial configuration was in place, the team began evaluating the models against known historical anomalies used as ground truth.
“Once we have a model in a good spot, it is pretty simple to run it in backtesting mode and compare the anomalies detected against known historical ones to assess overall quality. Also, with recent updates to the vmanomaly UI, it is even easier to visualize where the models are too tight or too loose and adjust accordingly.”
As part of the onboarding process, we worked together to refine the existing model configuration and align it more closely with the expectations on anomaly profiles and traffic patterns.
“One session with the VictoriaMetrics Anomaly Detection Team and we massively improved the existing model, and then added a whole new model to monitor a less extreme pattern.”
Real-World Incident Detected
#
Cloudflare Incident - Request Drop
#
Cloudflare faced an outage that directly impacted dependent services, resulting in a noticeable off-season drop in request volume for affected customers.
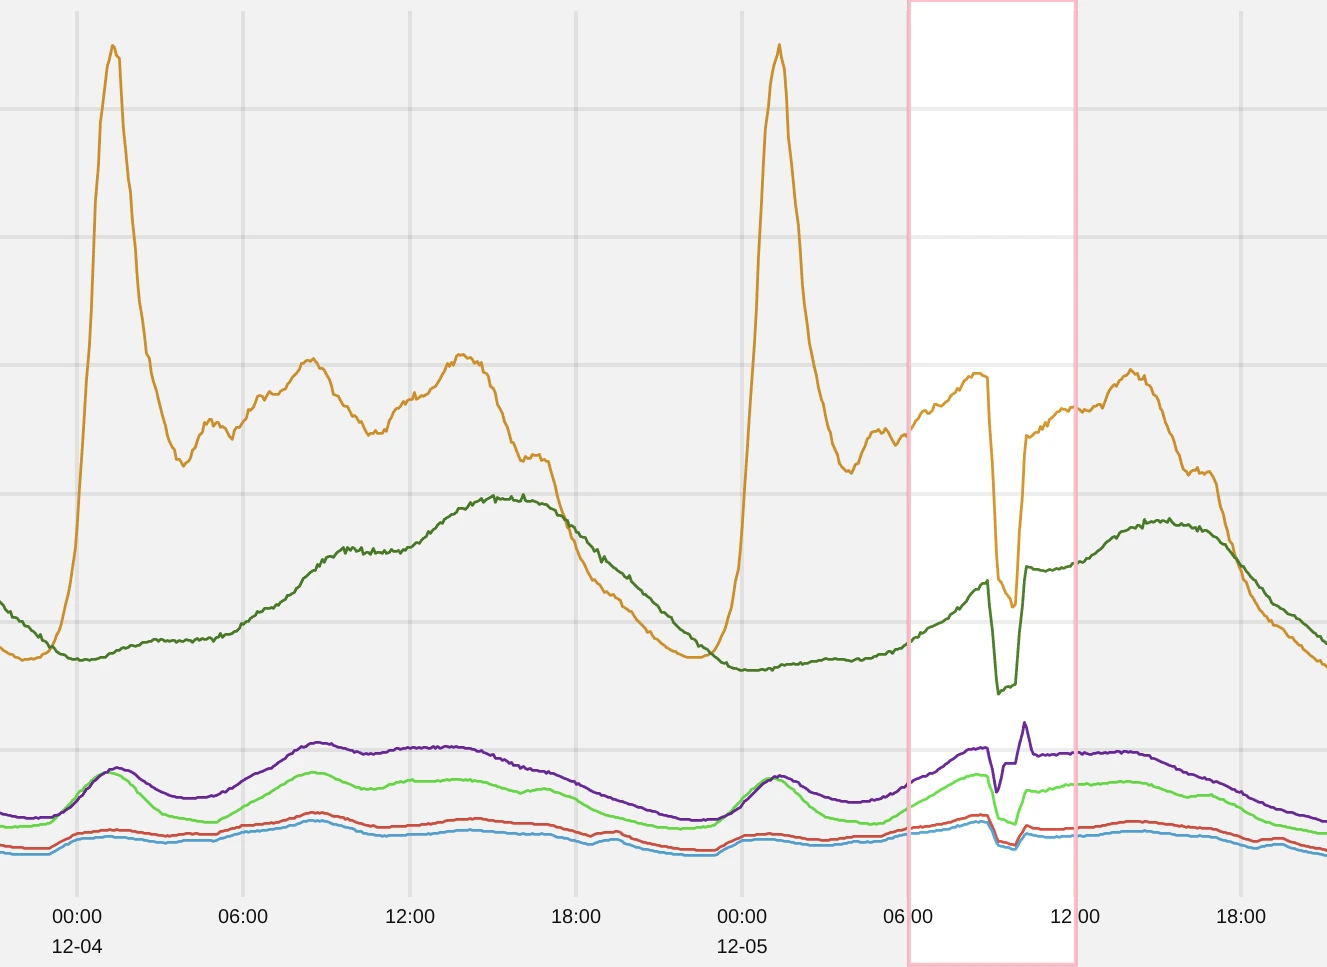 Cloudflare outage leading to request drop
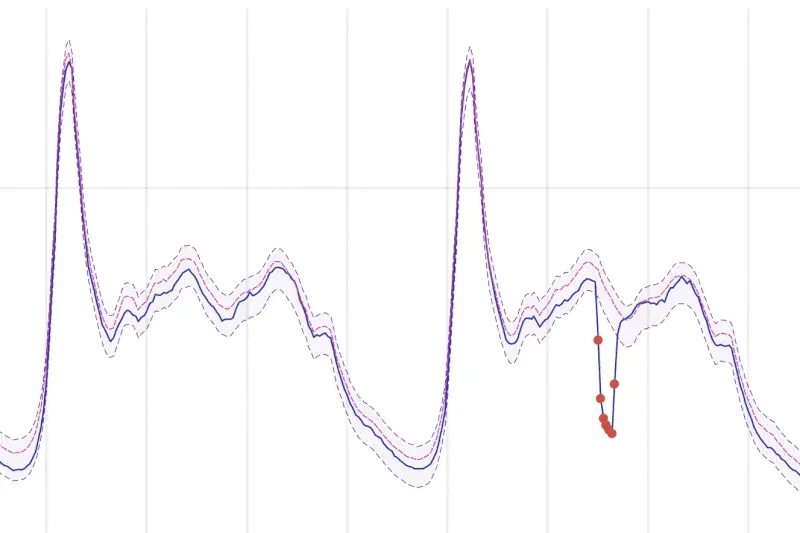 Example of detected anomalies during Cloudflare outage
Detected anomalies are shown as red markers, with an issue required to persist as “drop” for at least 30 minutes before being classified as an anomaly (so-called “streak")
New Version Release - Traffic Spike
#
Increased request volume following a new product release has affected connected applications and was detected as a controlled anomaly.
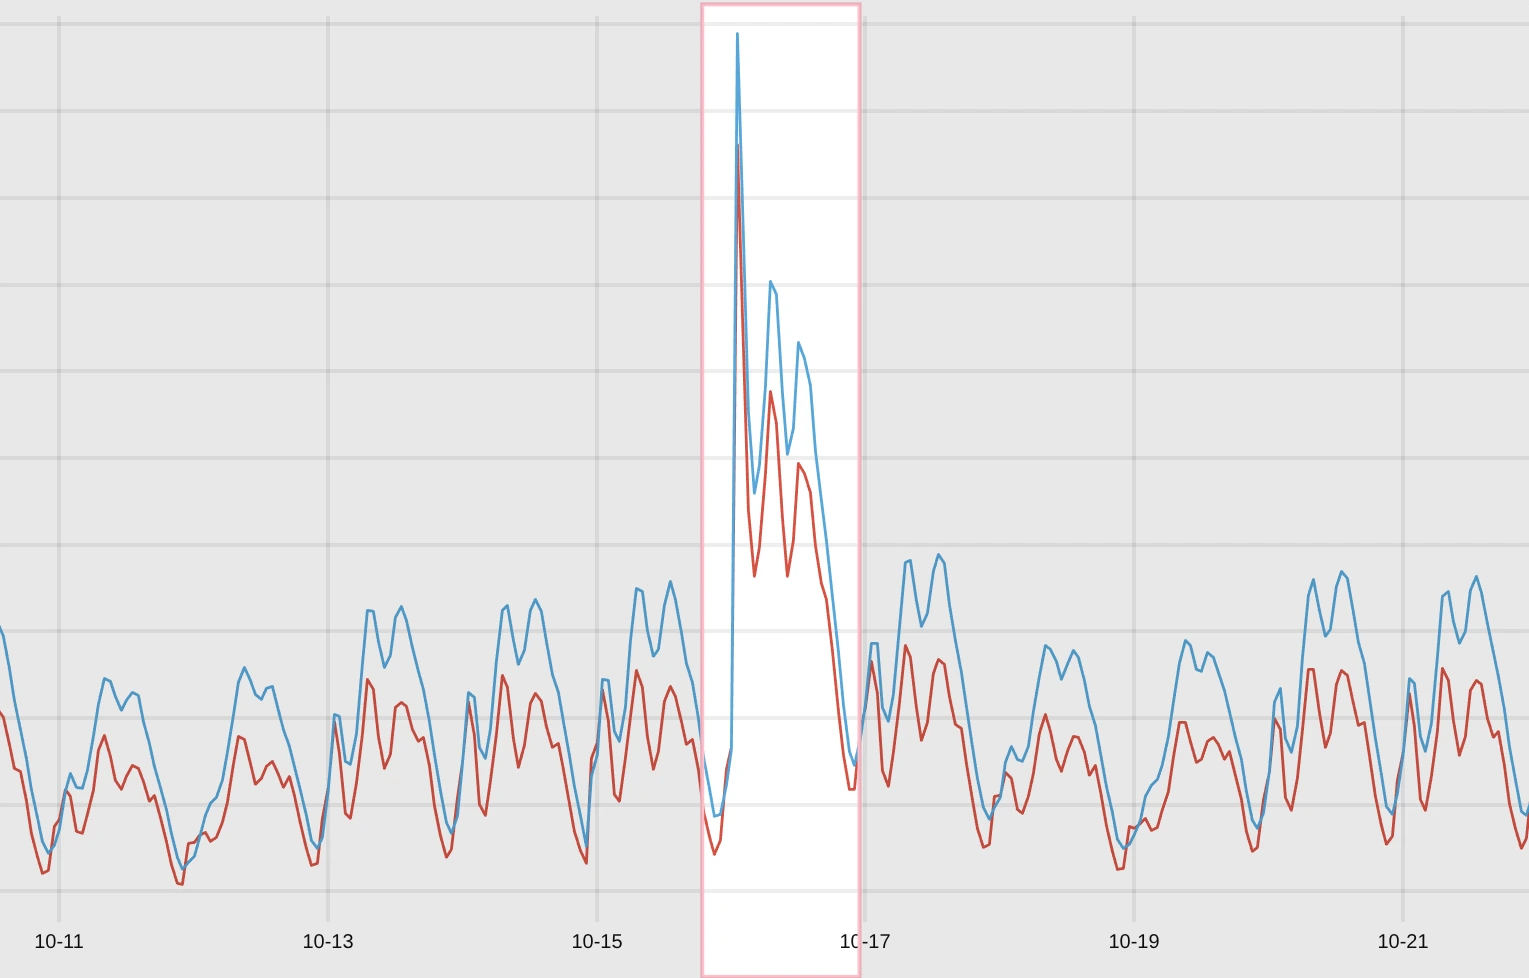 Traffic spike following new product release
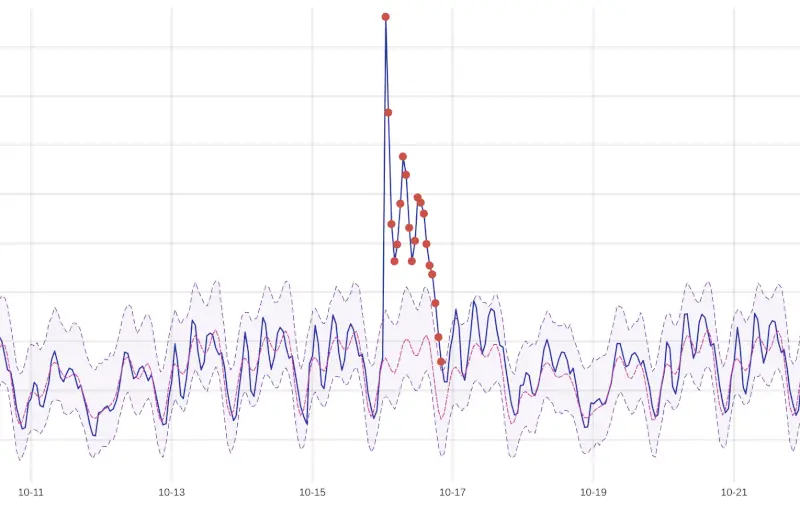 Example of detected anomalies during new product release
Detected anomalies are shown as red markers, with an issue required to persist as “spike” for at least 60 minutes before being classified as an anomaly (so-called “streak").
The Impact
#
As a result of deploying VictoriaMetrics Anomaly Detection, the customer reports improvements across several Key Performance Indicators (KPIs):
- Reduction in false positives requiring investigation, decreasing wasted engineering time.
- Higher confidence that real anomalies are not being missed, even across diverse traffic patterns.
- Reduced engineering effort to configure and maintain anomaly detection and alerting, due to a unified nature of produced anomaly score metrics.
Conclusion
#
This use case demonstrates how purpose-built anomaly detection - combined with flexible modeling, backtesting, and visualization - can replace brittle manual thresholding. For teams managing variable, organic traffic across multiple domains, VictoriaMetrics Anomaly Detection provides a practical and scalable path to reliable alerting without constant manual oversight.
I am Fred Navruzov and have previously worked as a Data Science Lead at Ukrainian and international companies such as Competera, Rozetka, and TiltingPoint. Since 2023, I have been leading the Anomaly Detection team at VictoriaMetrics.