- Blog /
- VictoriaTraces in VictoriaMetrics Cloud: Complete Observability is Here
VictoriaTraces in VictoriaMetrics Cloud: Complete Observability is Here
Share:


Earlier this year, we launched VictoriaLogs in VictoriaMetrics Cloud, bringing fast and cost-effective log management to everyone. Today we launch the final major step toward full observability: VictoriaTraces is now available to all cloud users.
With this release, you can now manage all three signals, metrics, logs, and traces, in one place with the predictable pricing, reliability, and the operational simplicity you’ve come to expect from VictoriaMetrics.
The Missing Signal
#
Logs and metrics are good enough when you only need to know what happened or how often it happened. But when a request travels through multiple services, none of them may be enough to explain where the problem lies.
Let’s say your dashboard shows elevated error rates and you start seeing timeout messages in logs. The rest of the dashboard looks normal: database is healthy, CPU, memory, and network seem normal. What’s wrong?
Without tracing, finding the problem is an exercise in trial and error. The service timing out may be the problem, or the slowdown may be caused by a downstream dependency that isn’t generating errors of its own. A distributed trace can pinpoint exactly where to look.
VictoriaTraces in Cloud gives you a managed tracing backend you can use to monitor and diagnose any distributed system such as:
- Microservices in Kubernetes
- Serverless architectures
- Event-driven systems
- Multitenant SaaS
- Batch and data pipelines
- Tracing of fleets for AI training or inference
- Or any system composed of more than a handful of services
How Does VictoriaTraces in Cloud Work?
#
VictoriaTraces in VictoriaMetrics Cloud is a fully managed distributed tracing service. You ingest, store, and query distributed tracing data without running a tracing backend yourself.
The VictoriaMetrics team handles provisioning, authentication, monitoring, audit logs, backups, software updates, and the deployment lifecycle. Everything is managed for you and covered under the VictoriaMetrics Cloud SLA.
Deploy
#
To start your first VictoriaTraces deployment:
Log in with your VictoriaMetrics Cloud account
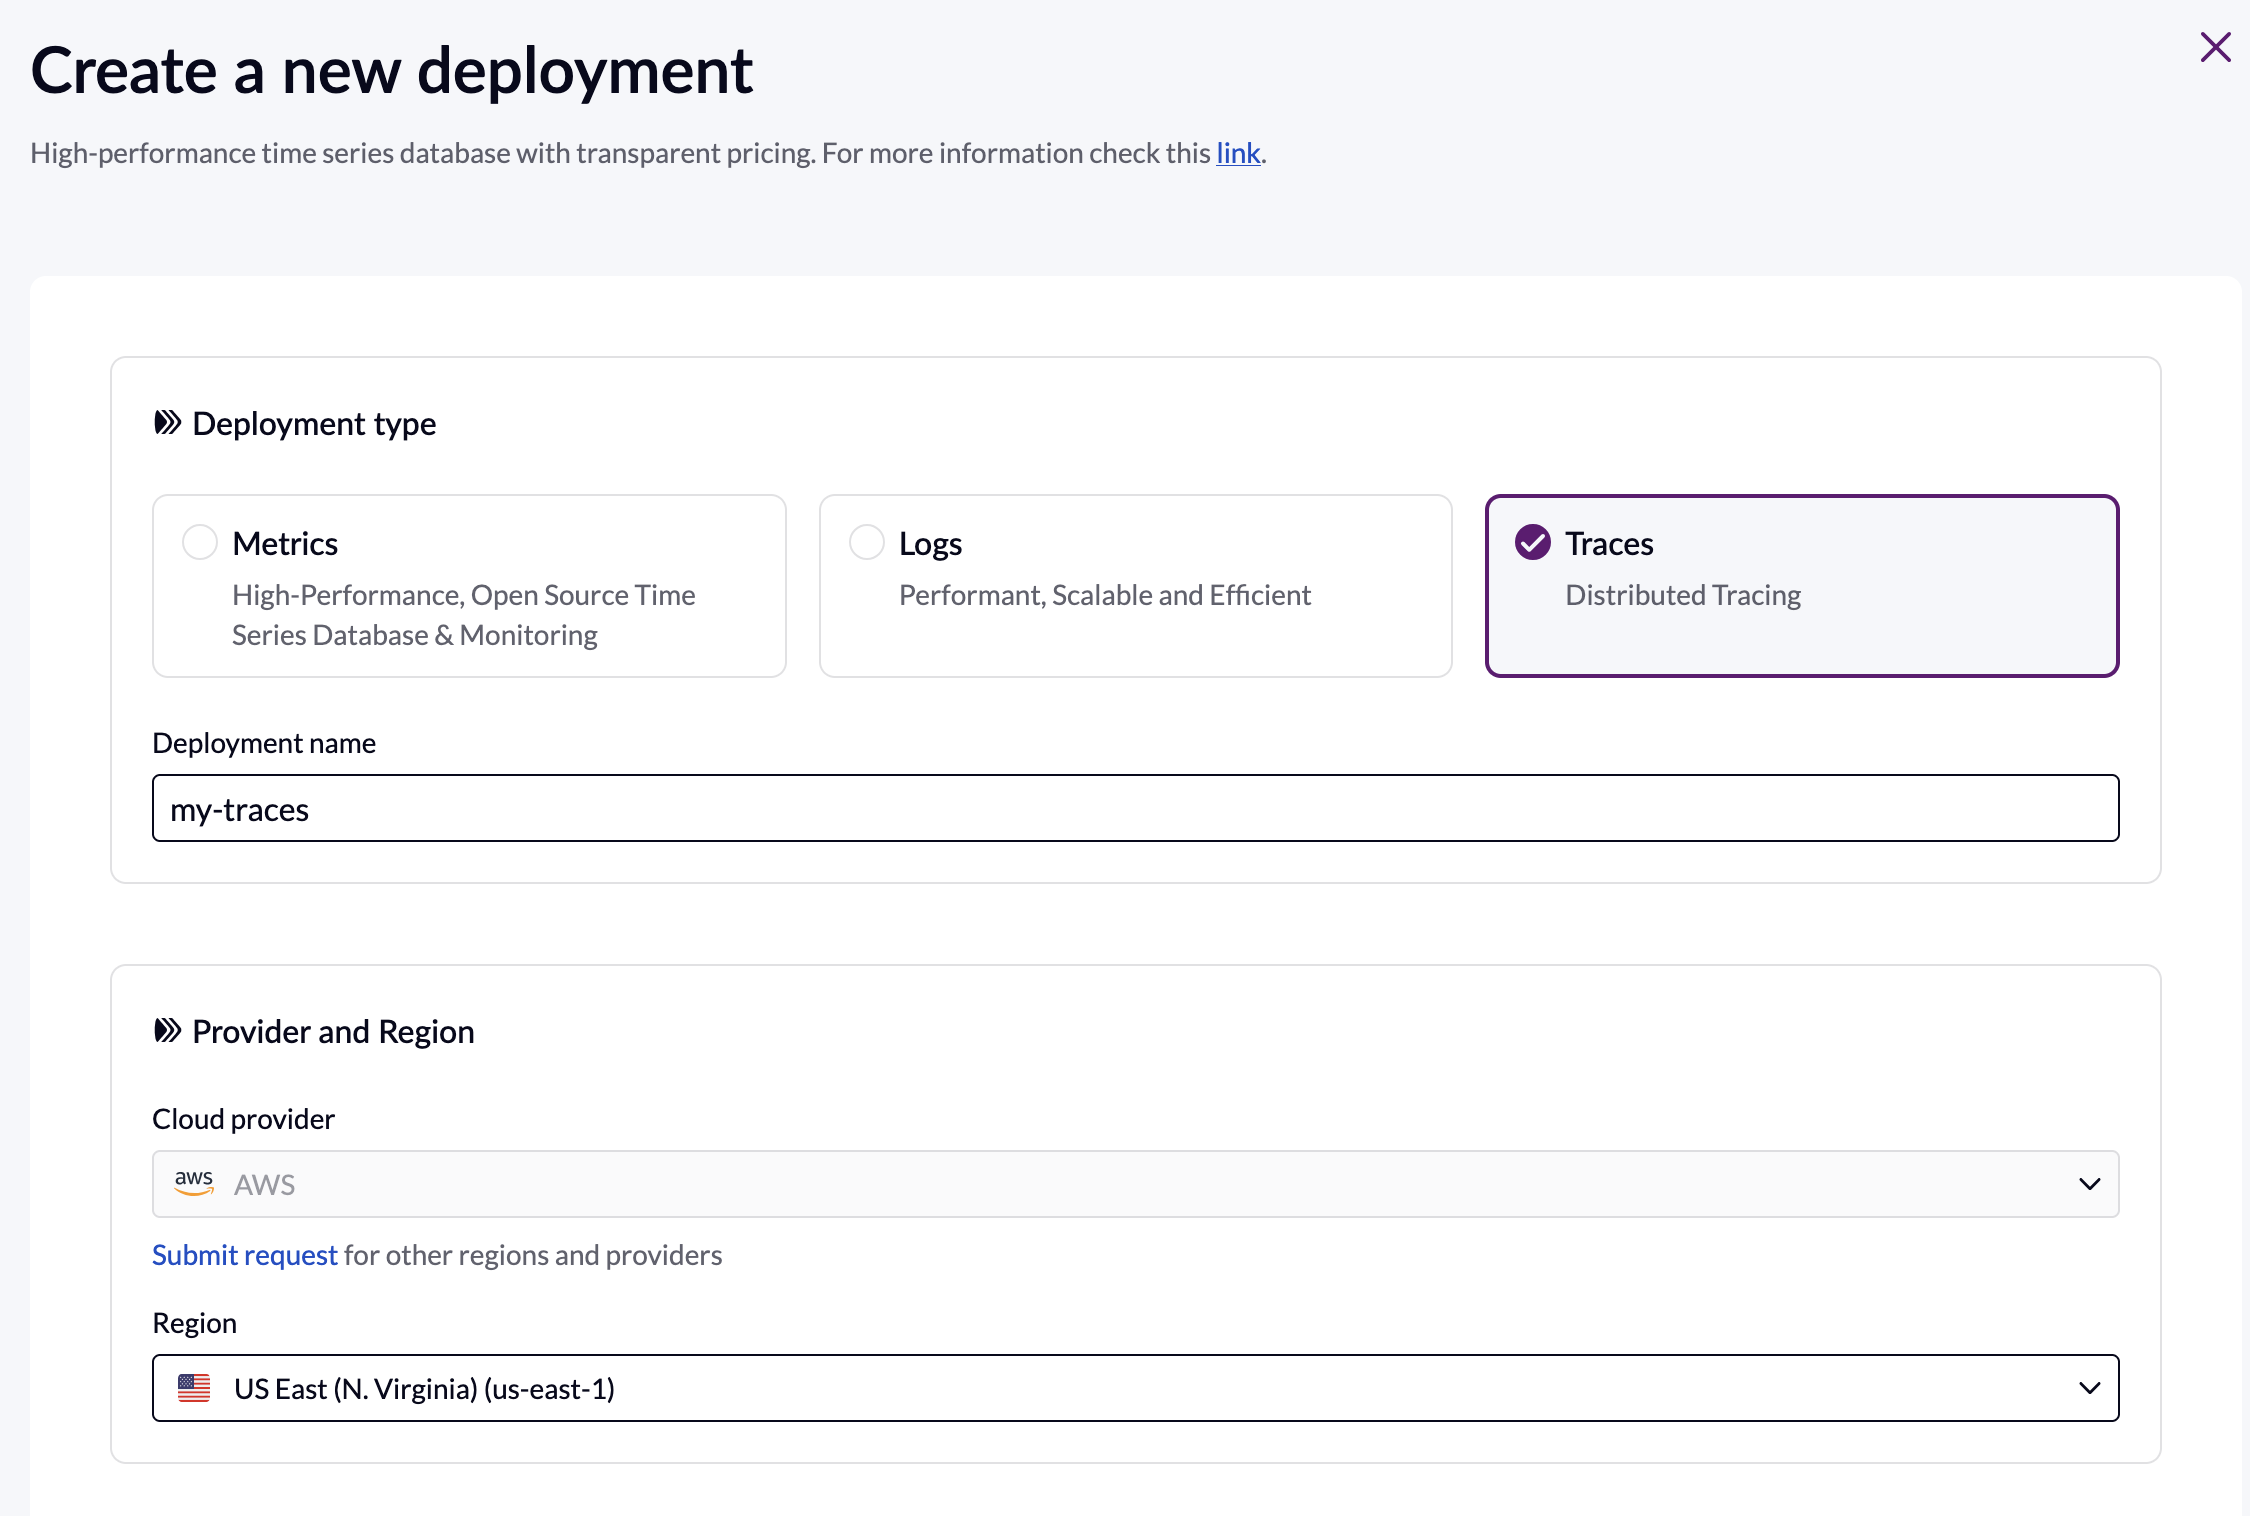
Press Create Deployment and type the deployment name
Select the region for the AWS deployment
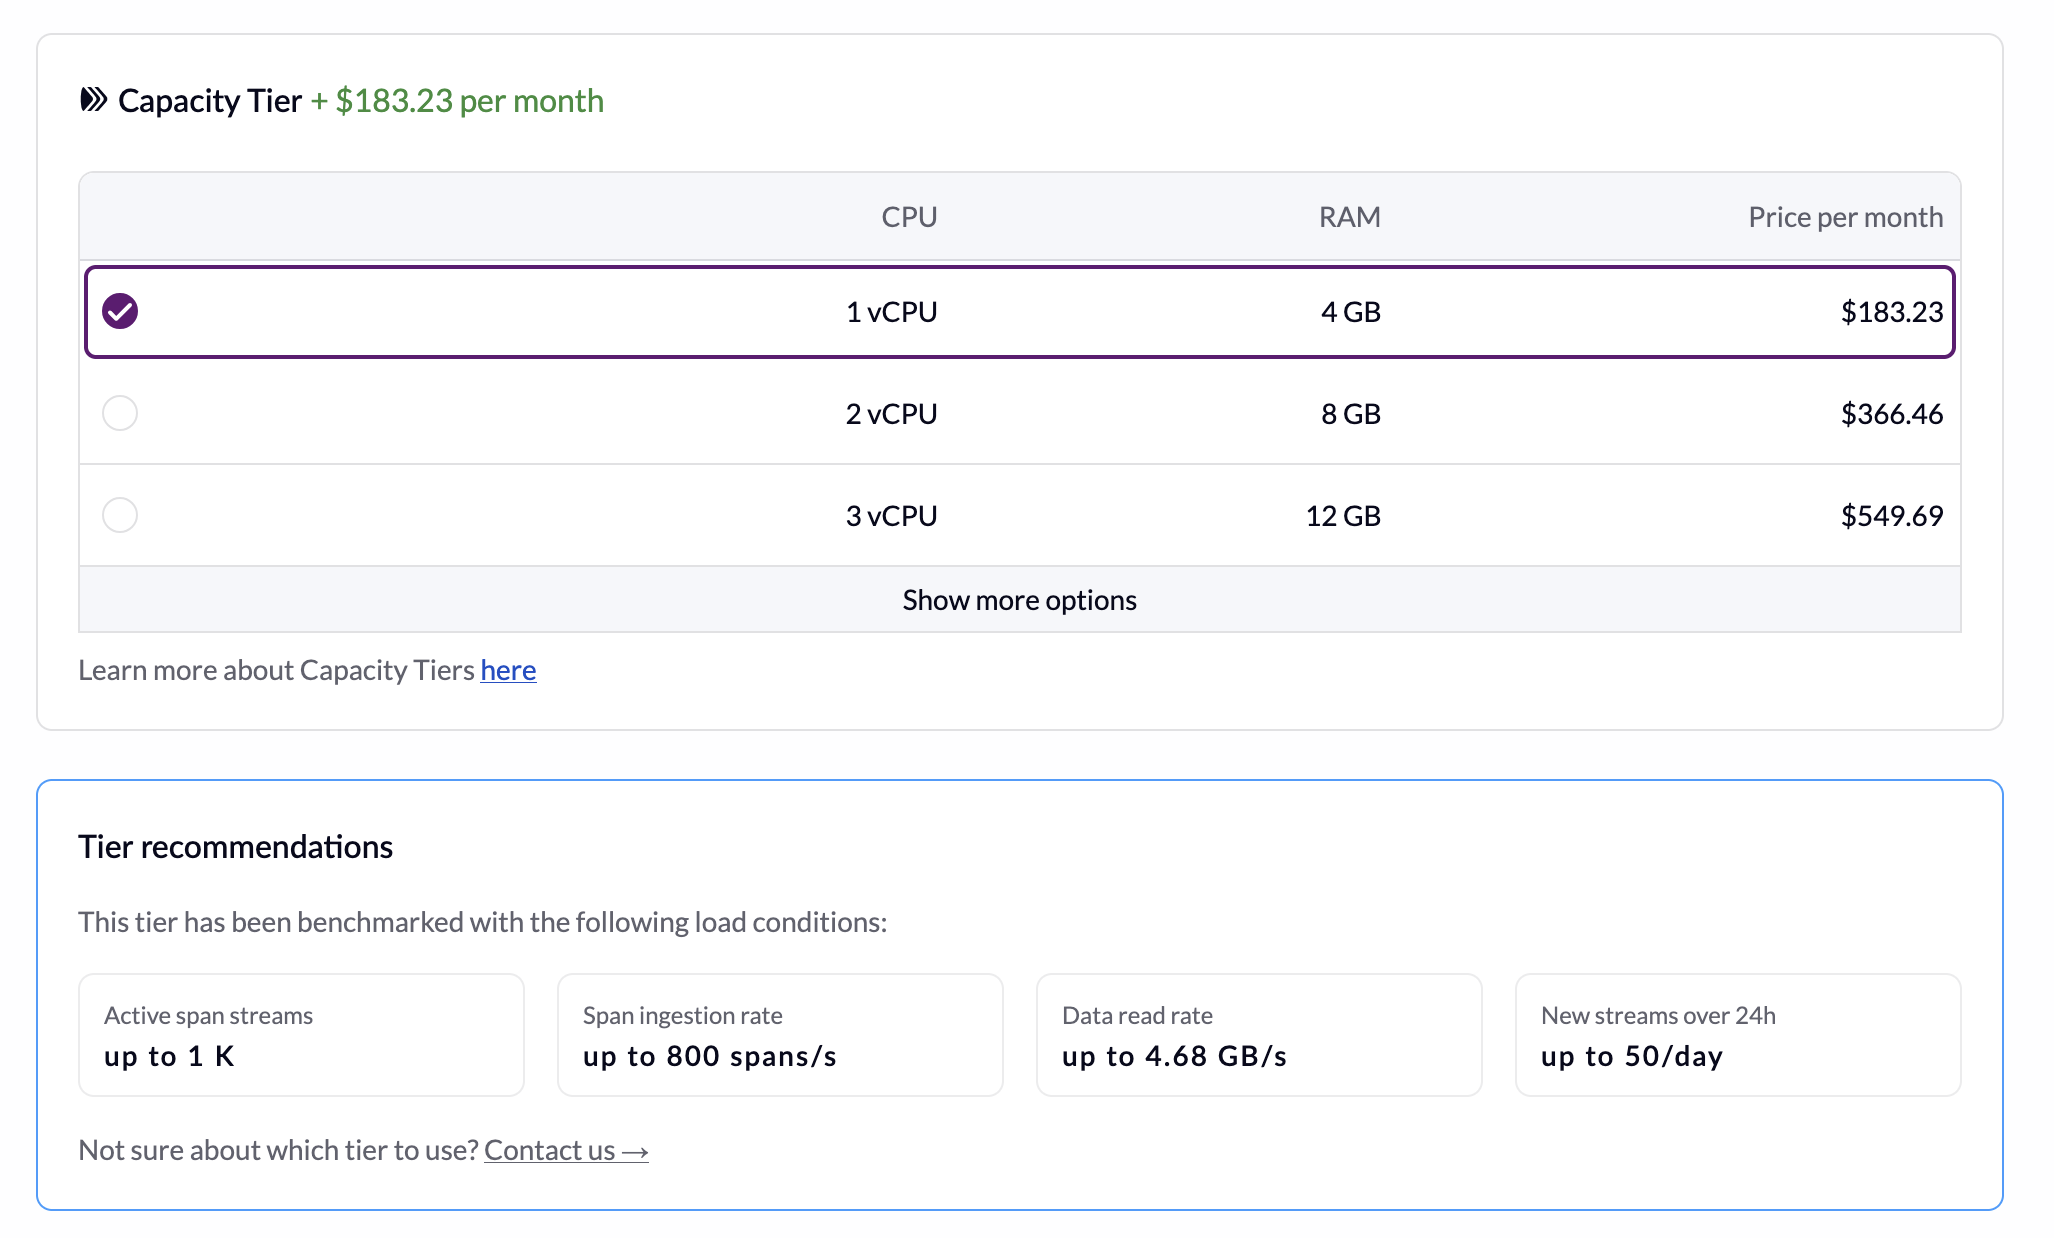
Select your tier. You can always upgrade or downgrade later
Type your desired retention and storage (storage is suggested based on your retention).
Press Create
That’s it. Your VictoriaTraces deployment should be ready to use in a few minutes. If you have any doubts, check out the Quick Start guide, or contact us.
Send
#
Now it’s time to send your data. VictoriaTraces in VictoriaMetrics Cloud ingests OpenTelemetry Protocol (OTLP).
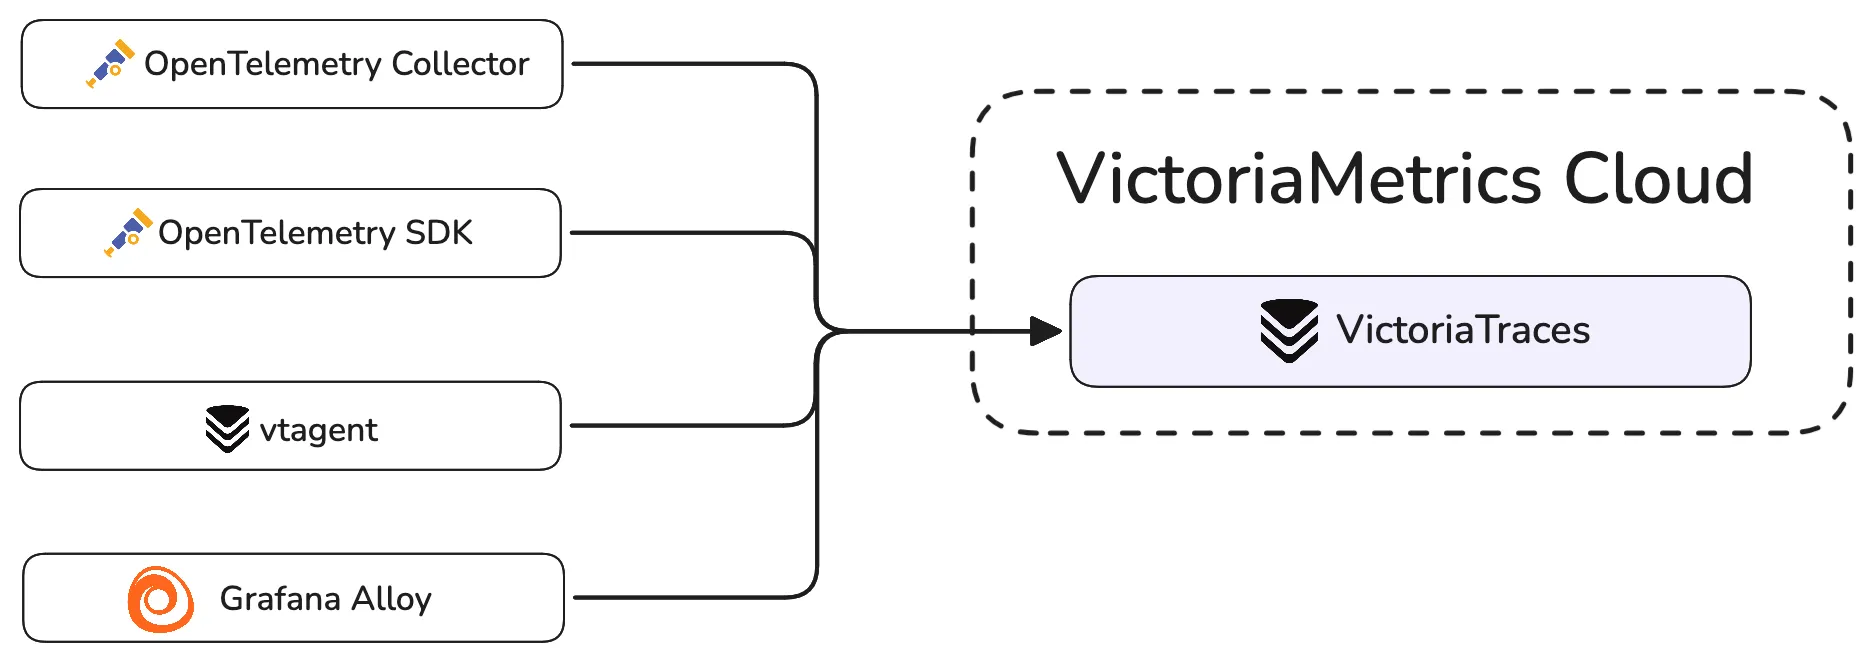
This lets you collect distributed tracing data from a huge variety of sources.
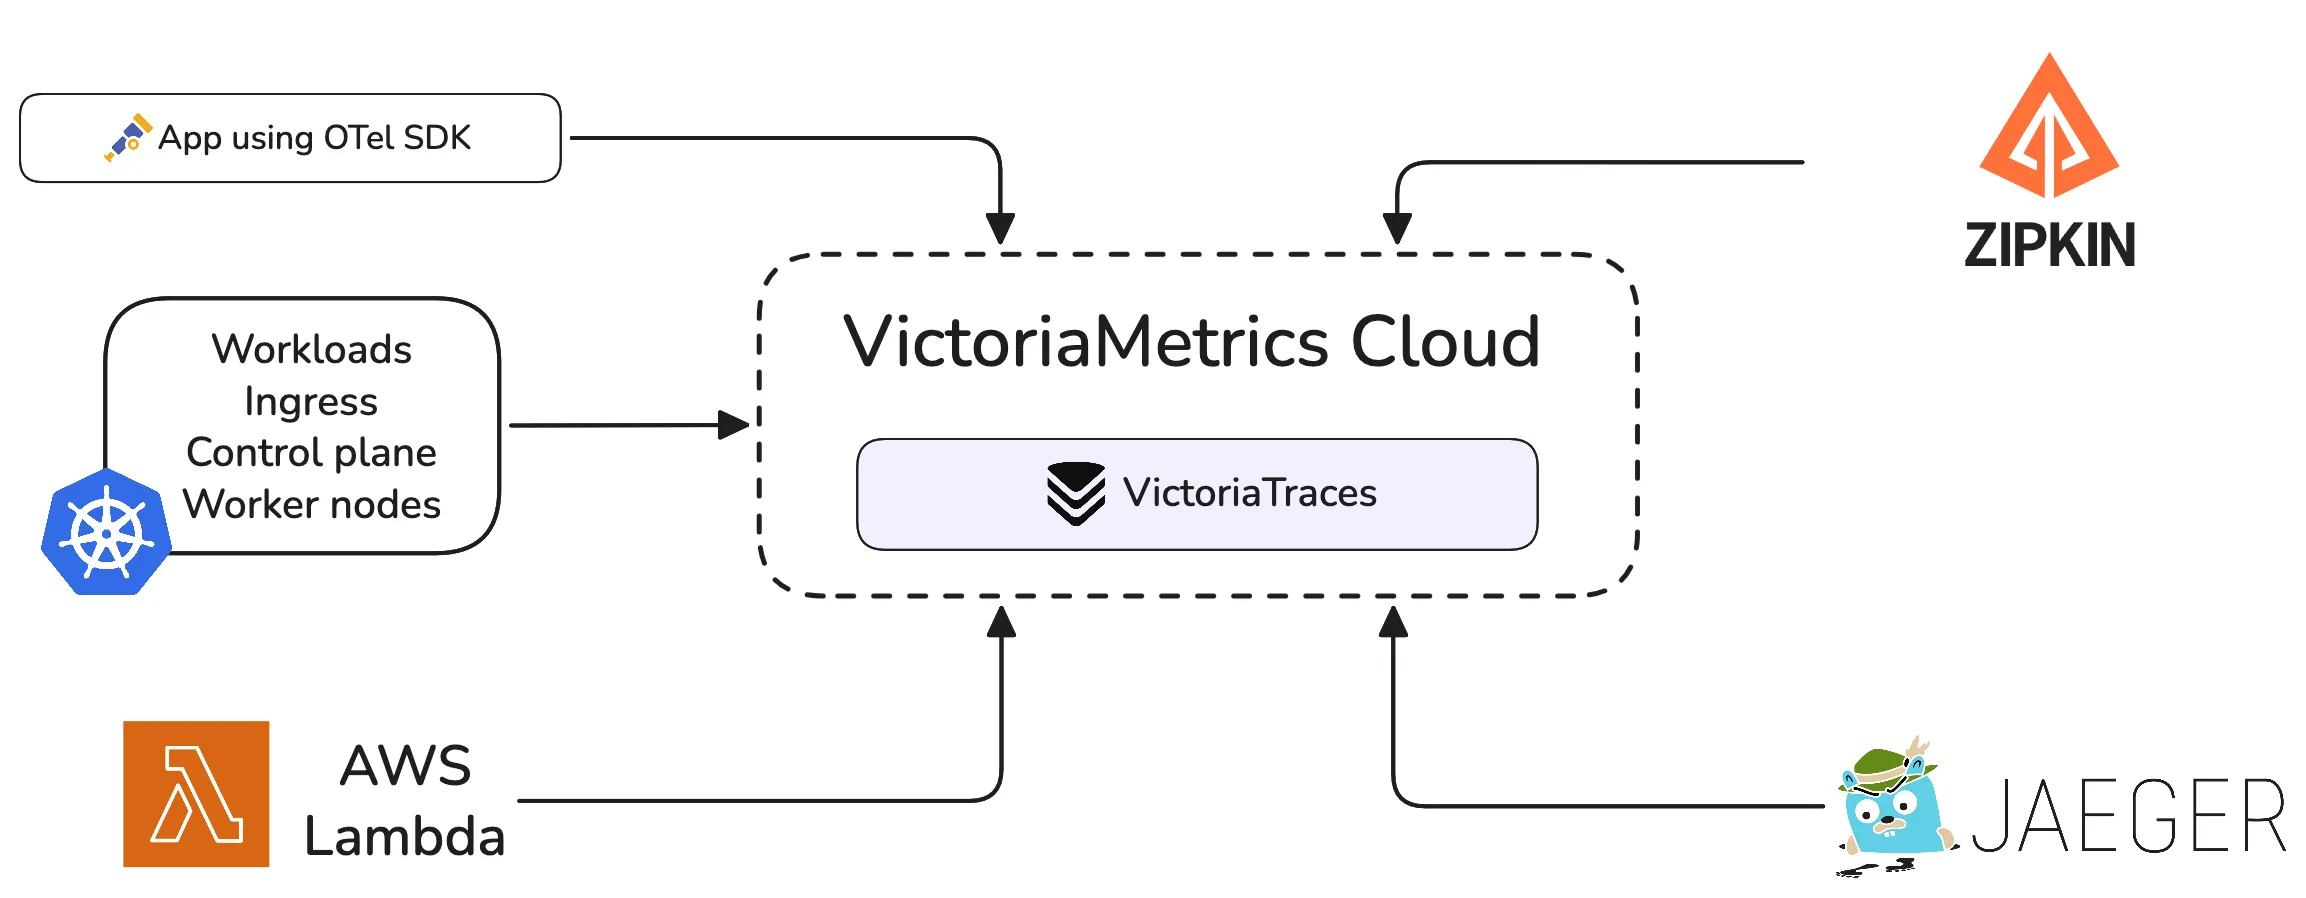
To start sending data, you’ll need a write token:
- Select your deployment
- Go to Access Tokens
- Generate a new token with Read/Write permissions
- Copy the token value and save it in a safe place.
Next, you’ll need the endpoint URL:
- Select your deployment
- Go to Overview
- Copy the URL shown next to Endpoint
Connect your OpenTelemetry Collector over HTTP, Grafana Alloy, vtagent, or use the OTel SDK to send distributed tracing data to VictoriaMetrics Cloud. The following snippet shows how to configure the OTLP Collector. Fill in your endpoint URL and access token.
exporters:
  otlphttp/victoriatraces:
    traces_endpoint: https://<DEPLOYMENT_ENDPOINT_URL>/insert/opentelemetry/v1/traces
    headers:
      Authorization: "Bearer <ACCESS_TOKEN>"
    compression: gzip
    encoding: proto

service:
  pipelines:
    traces:
      receivers: [otlp]
      processors: [batch]
      exporters: [otlphttp/victoriatraces]
Analyze
#
Use the built-in UI to query your data using LogsQL, the same query language used by VictoriaLogs.
To access the UI, select Explore on your deployment menu.
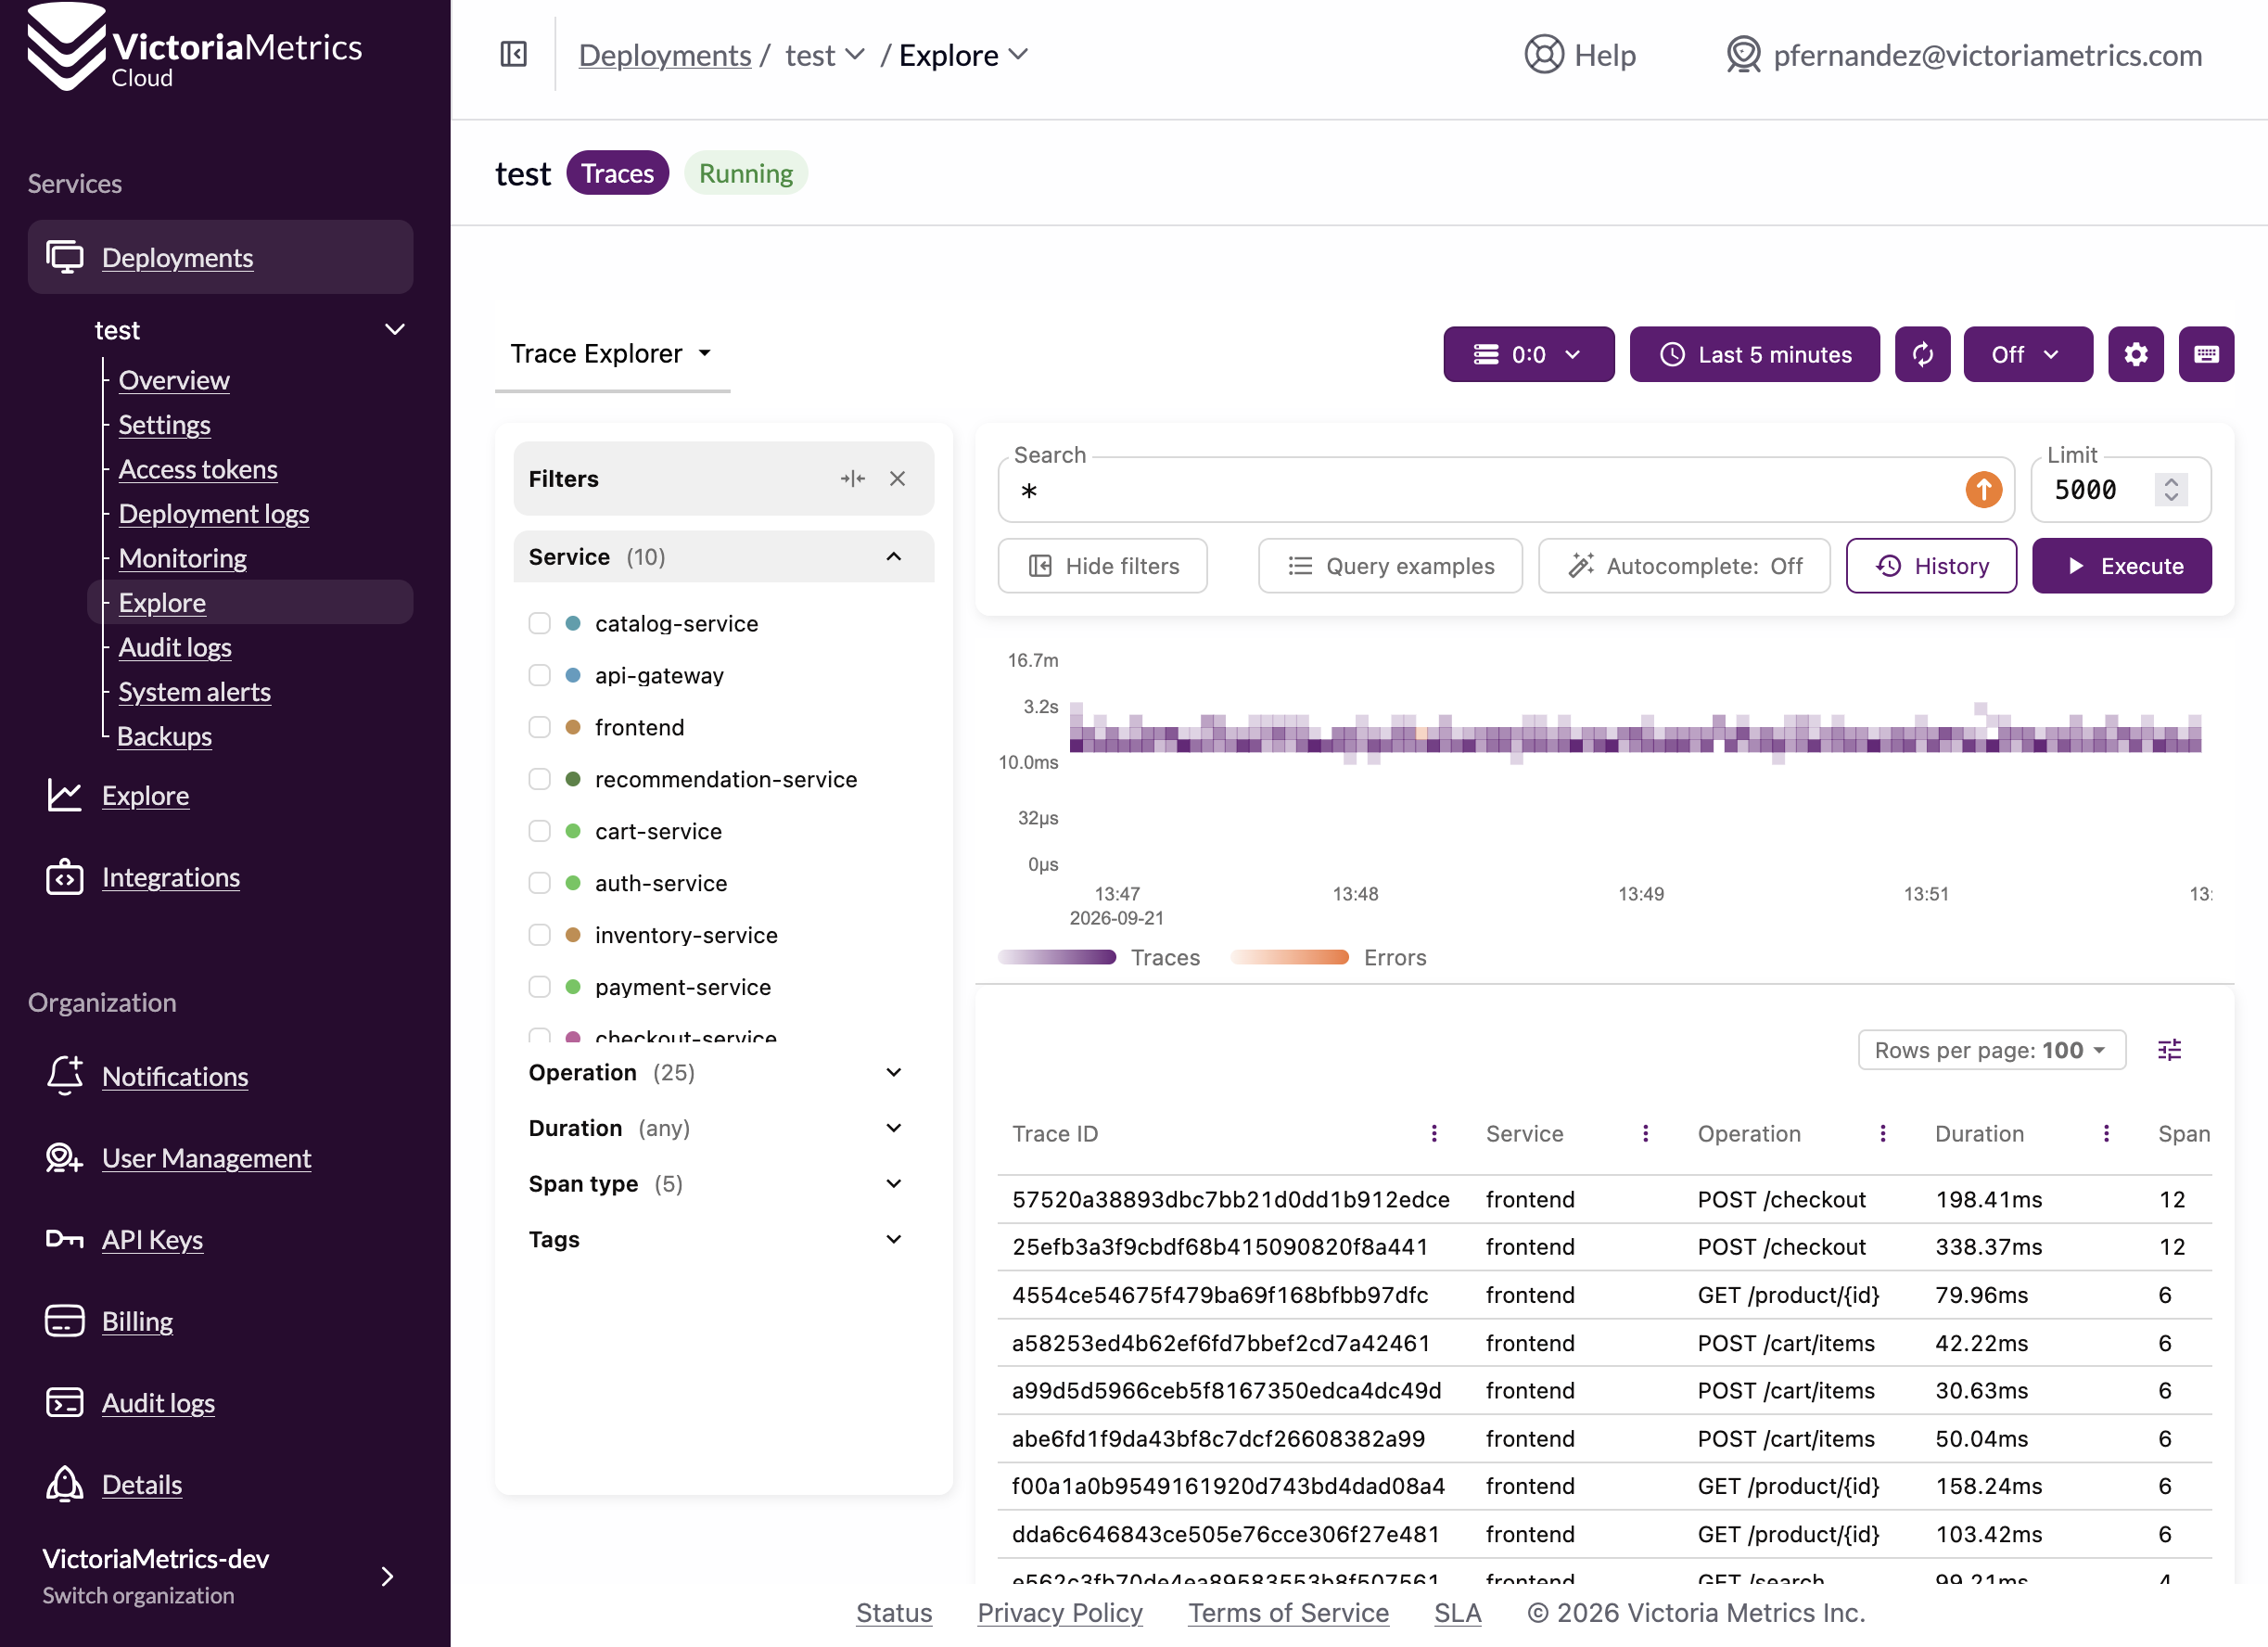
Here you can use LogsQL to query your traces data directly. The UI shows filters based on the data in your deployment.
Integrate
#
To visualize your data in dashboards, plug in Grafana or Jaeger using a Jaeger or Tempo datasource. Below is a small taste of what you can achieve with Grafana and VictoriaTraces.
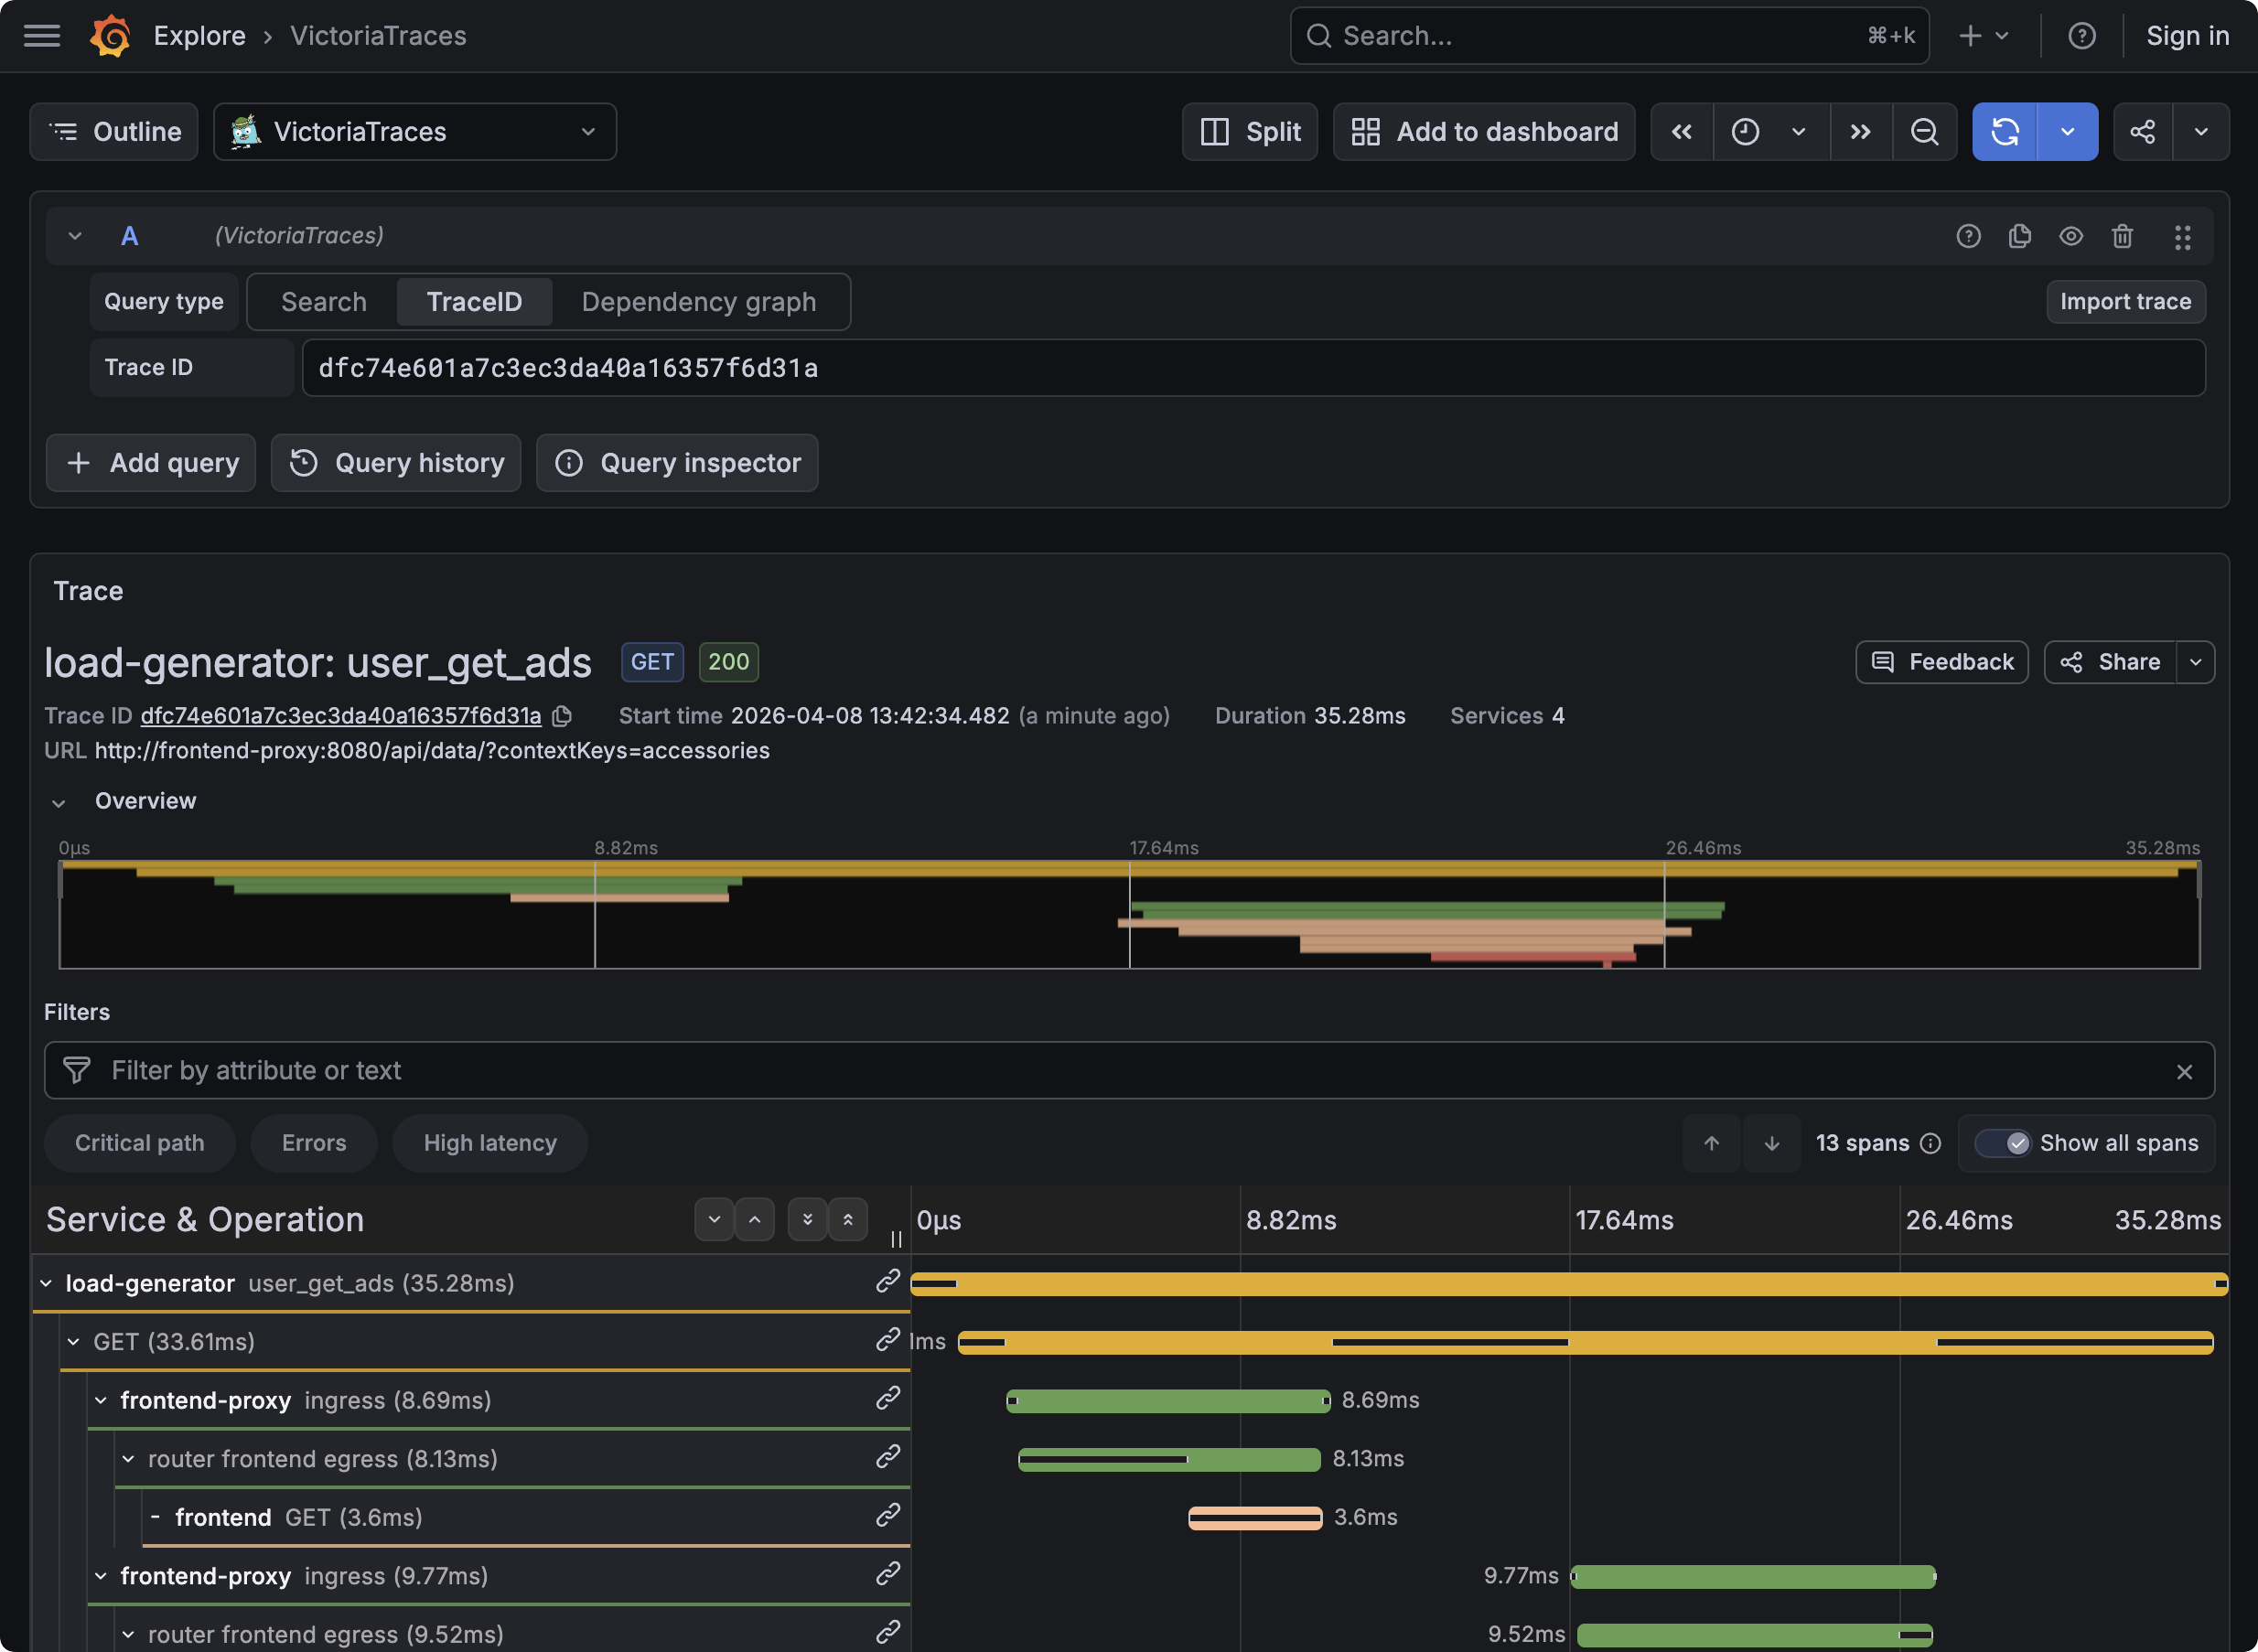
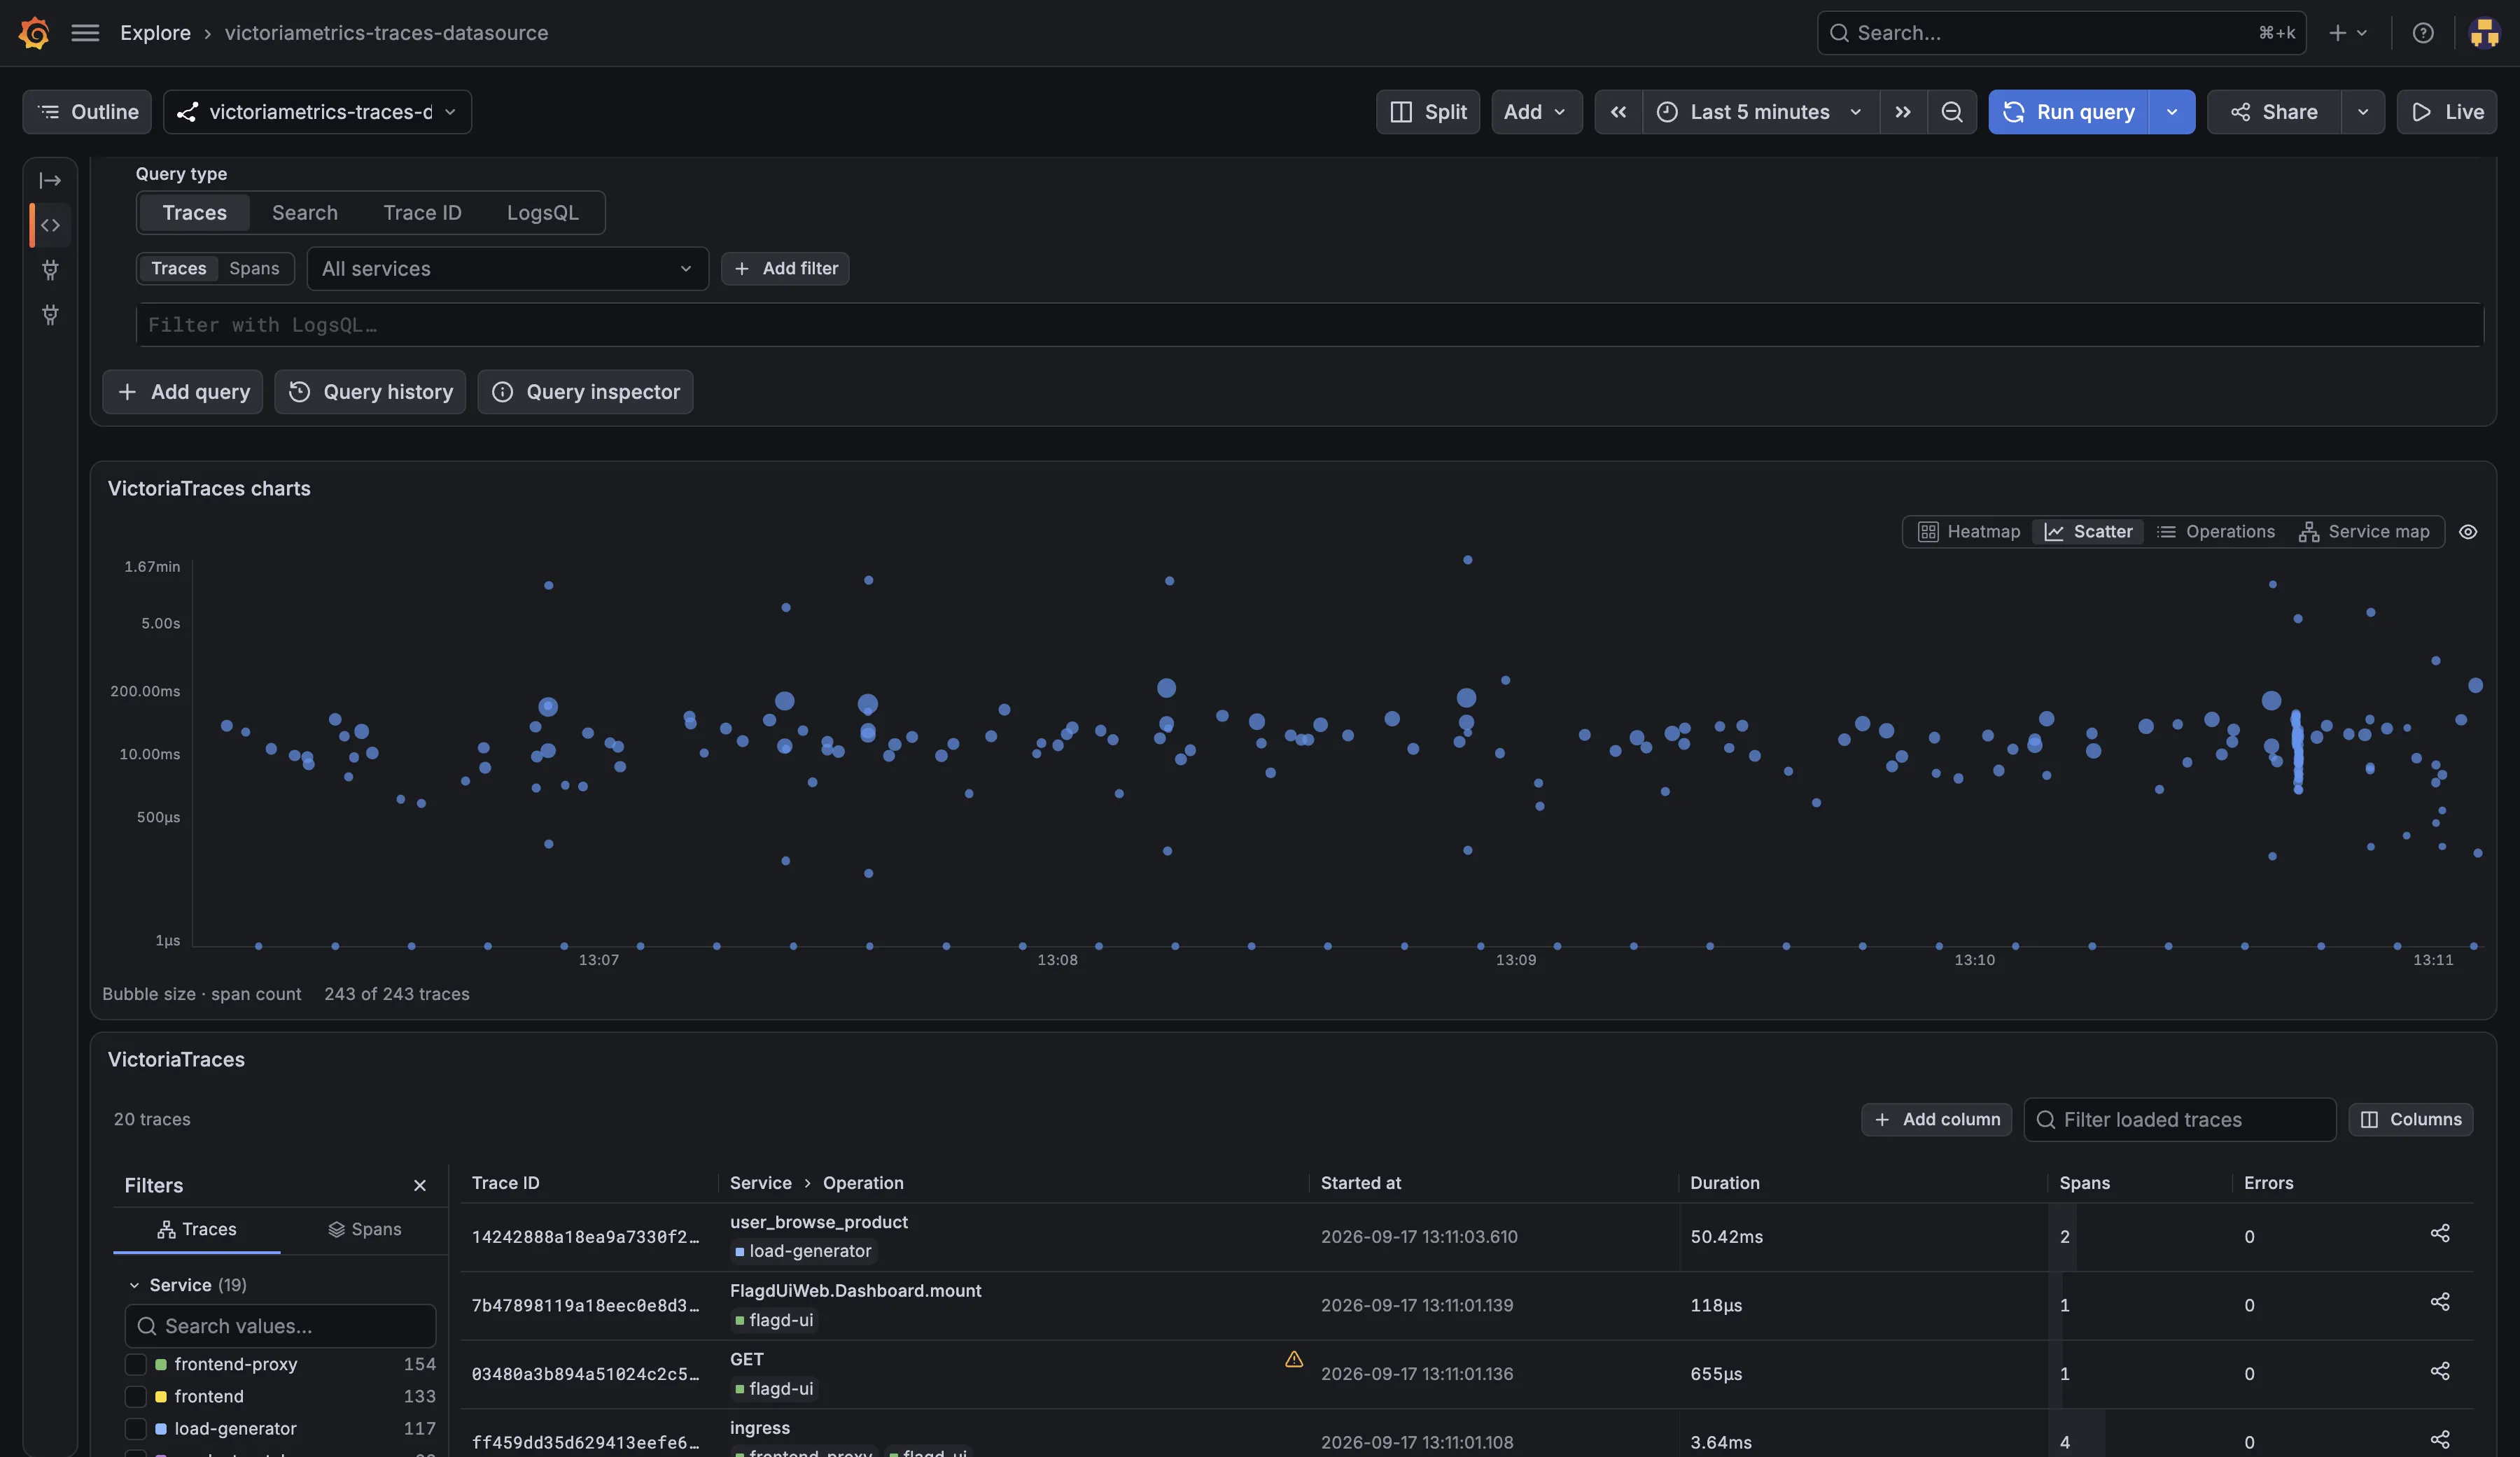
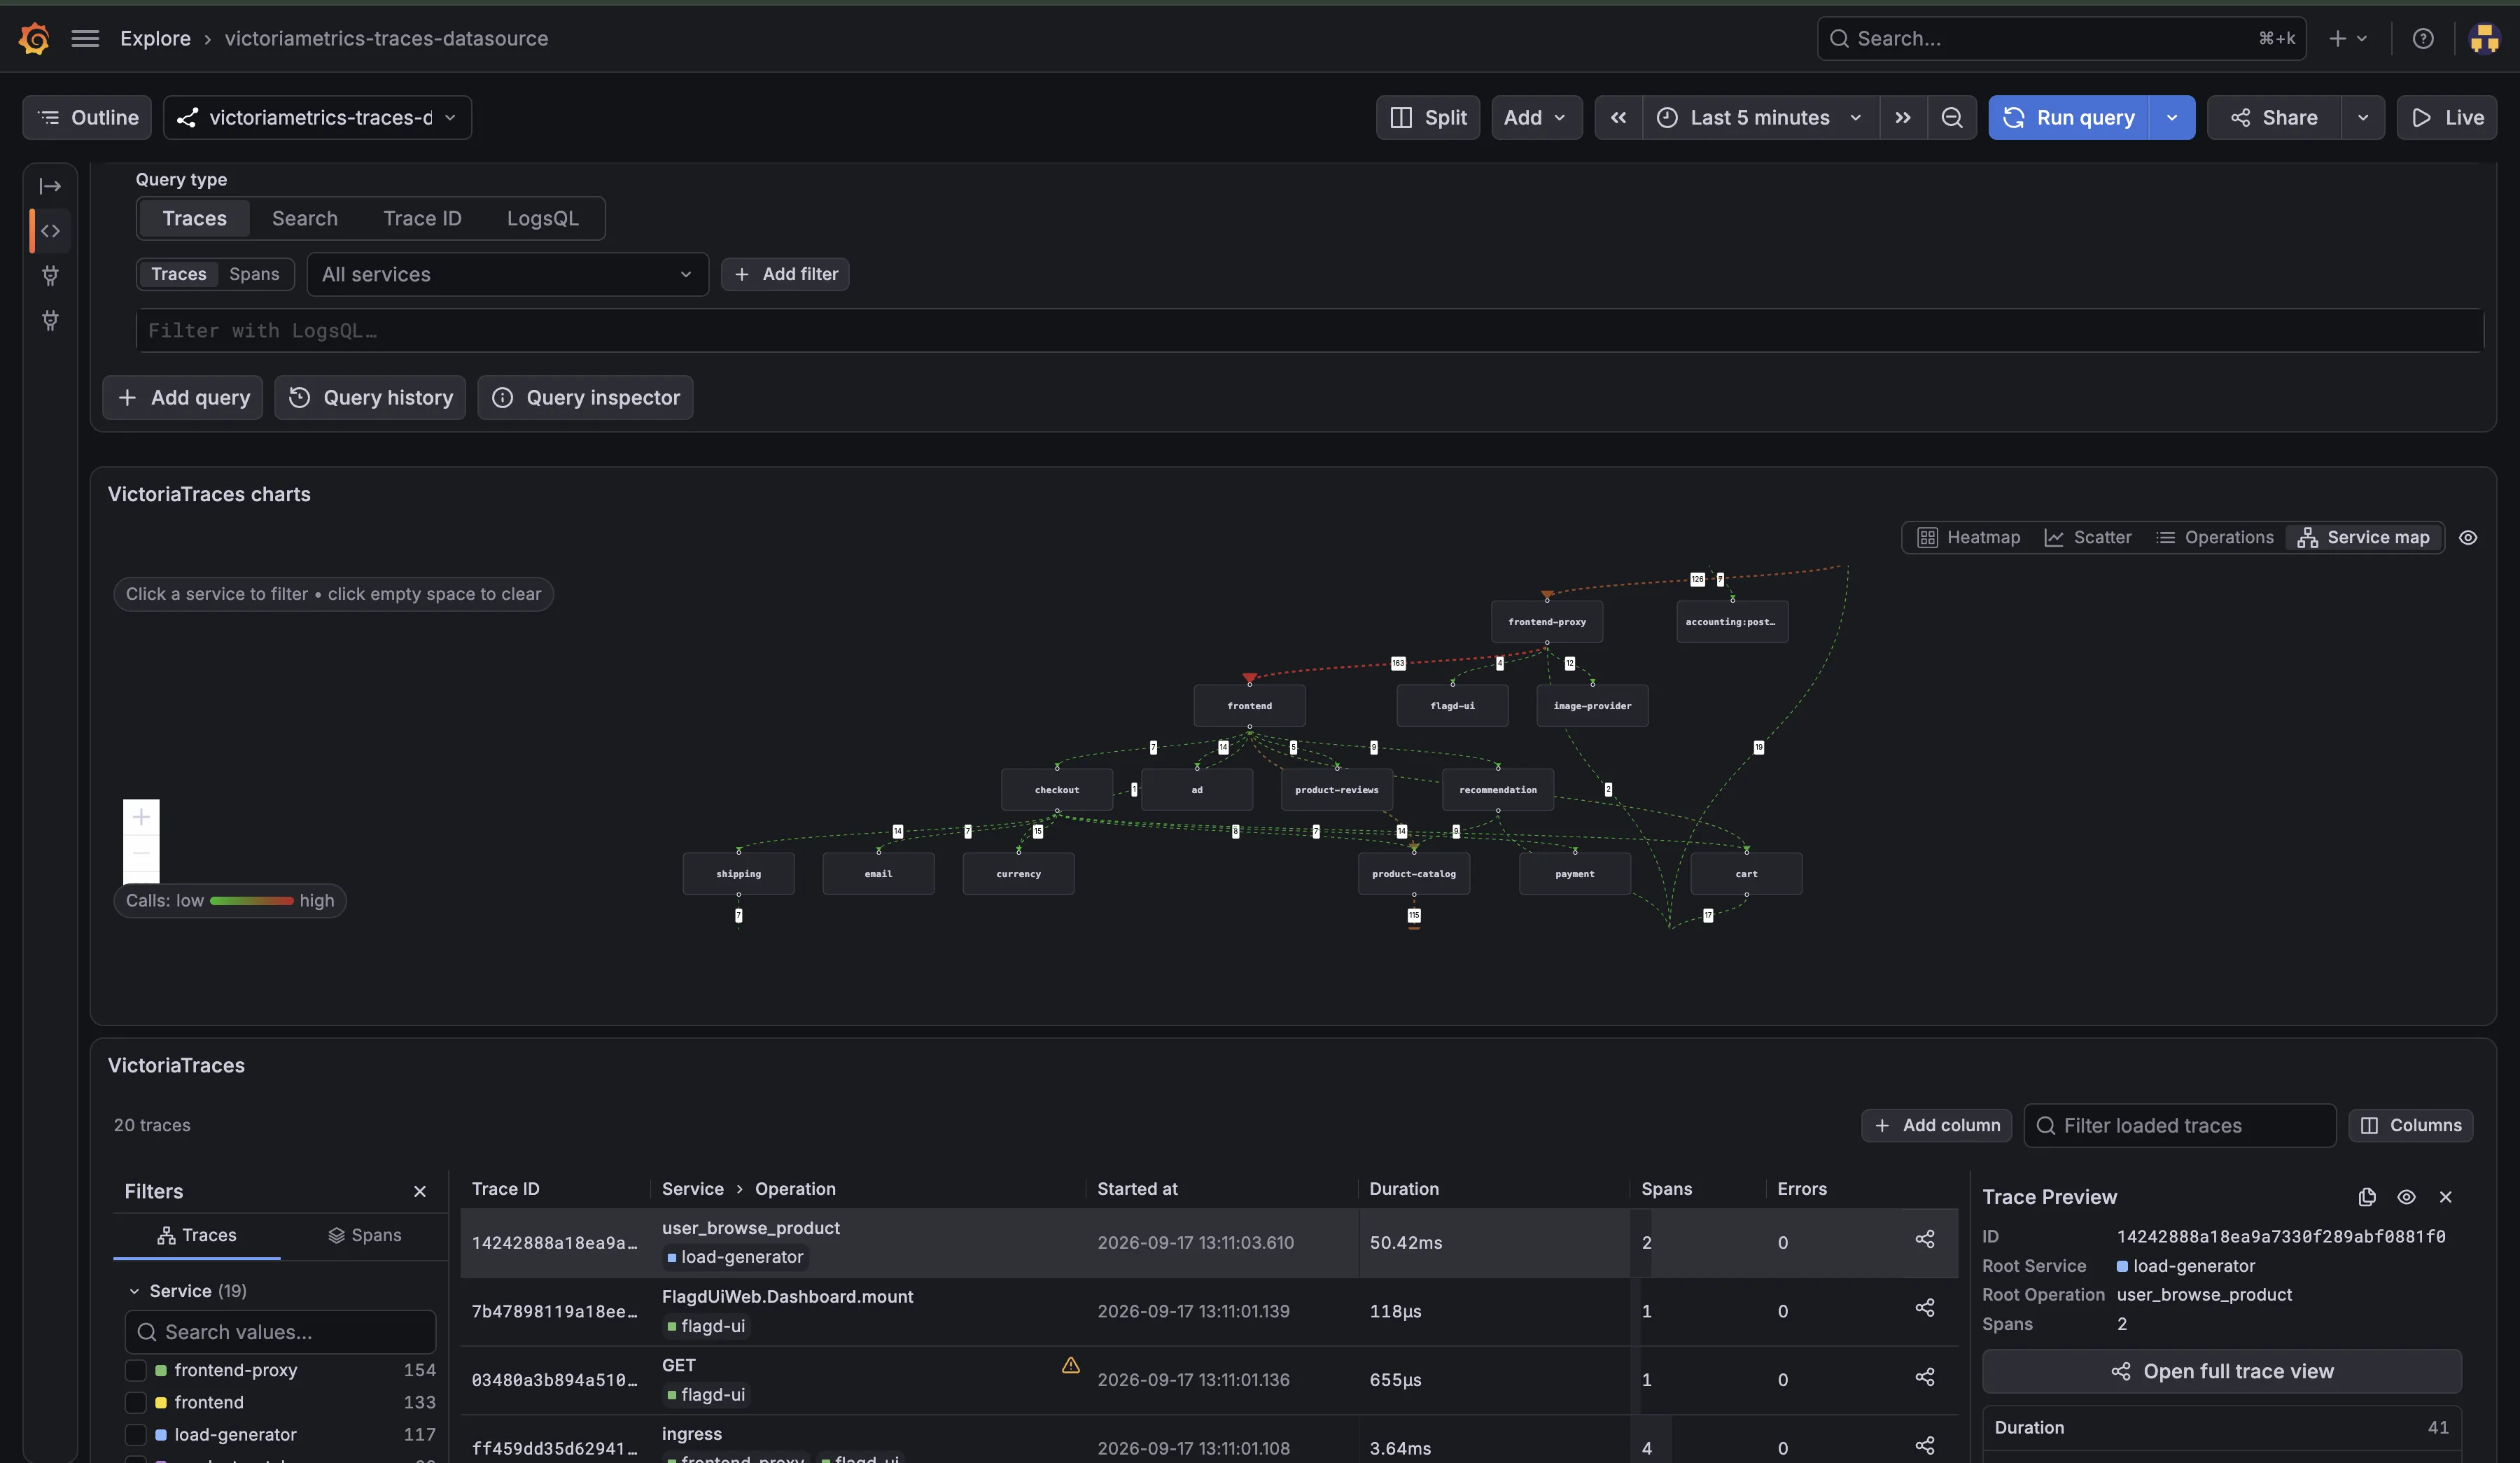
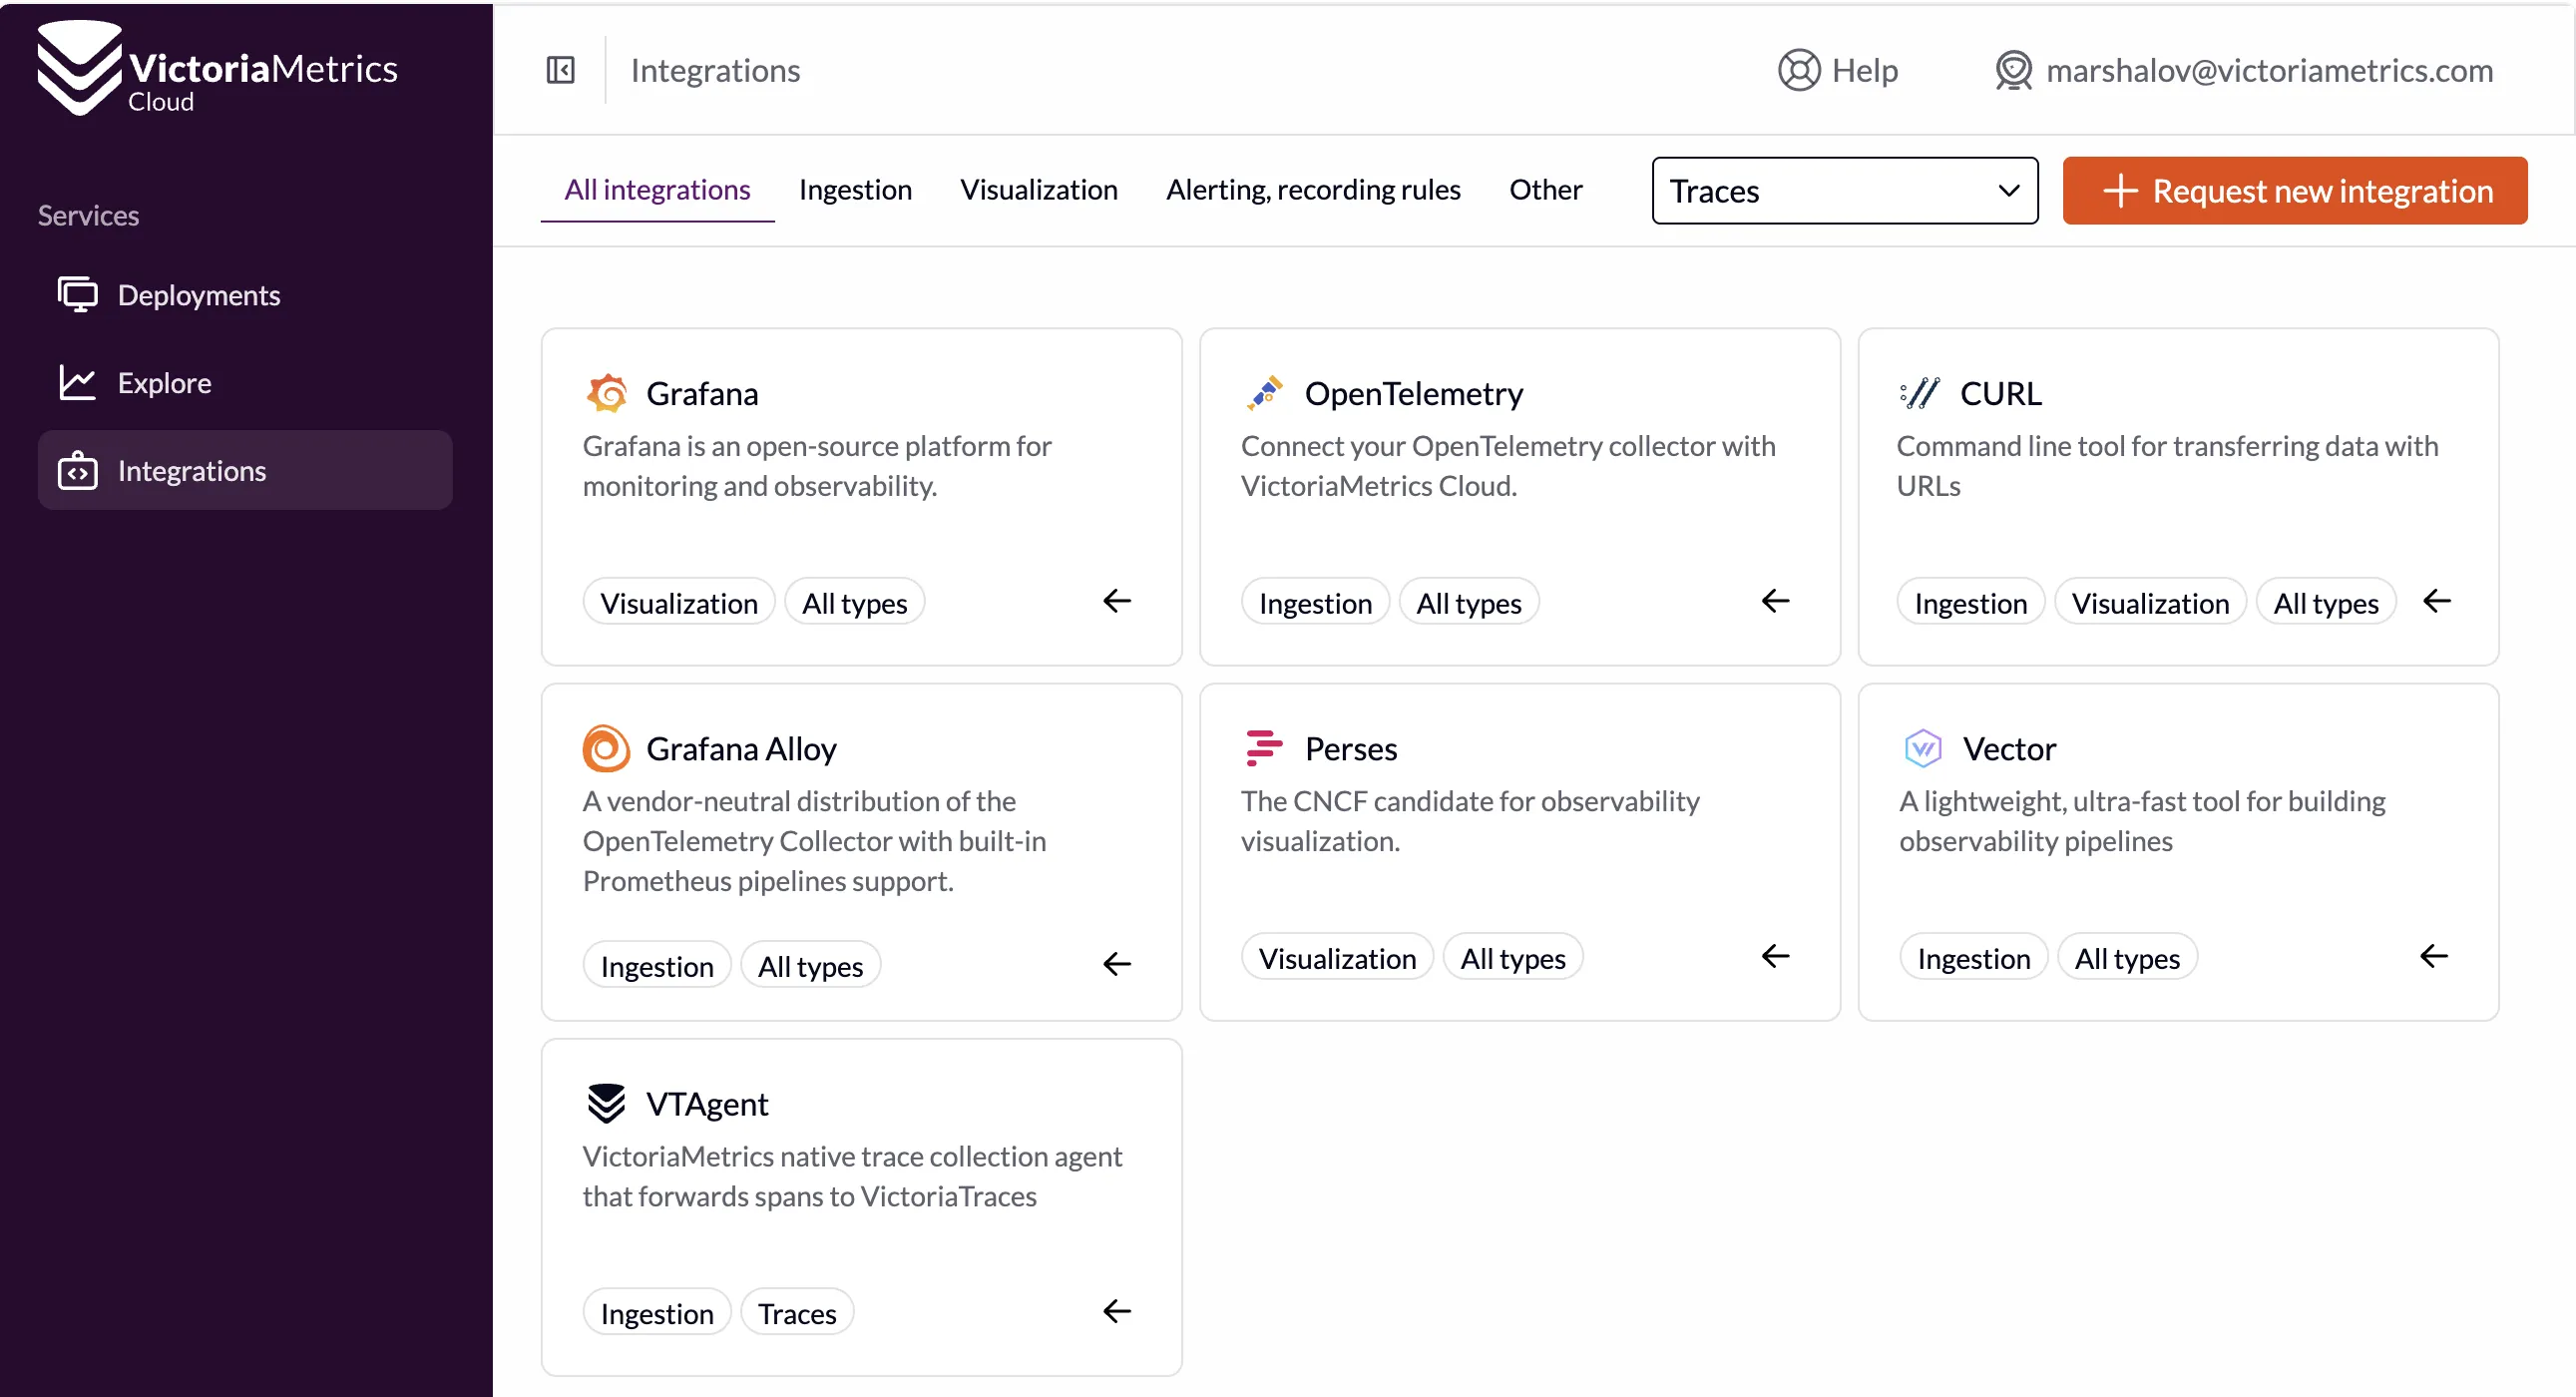
You can check all integration guides in the Integrations section in the VictoriaMetrics Cloud console.
Predictable Pricing with Capacity Tiers
#
Like everything else in Cloud, VictoriaTraces is offered based on capacity tiers. This makes costs easy to forecast. You can upgrade or downgrade the tier as usage fluctuates.
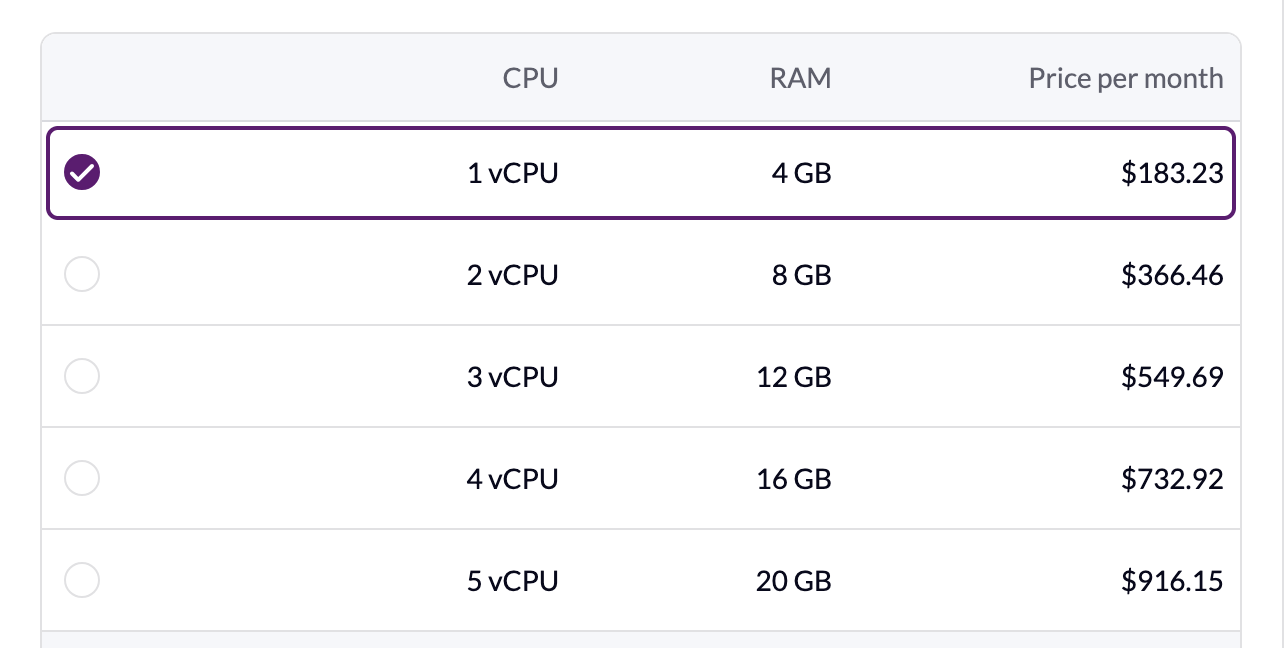
Choose the capacity tier based on the expected data to ingest.
| Tier | Span Ingestion Rate (spans/s) | Data Ingestion Rate (MB/s) | New Streams over 24h |
|---|---|---|---|
| 1 | 800 | 0.8 | 50 |
| 2 | 1200 | 1.2 | 60 |
| 3 | 2200 | 2.0 | 60 |
| 4 | 3200 | 3.2 | 80 |
| 5 | 5000 | 4.5 | 80 |
And on the query load you expect to have.
| Tier | Data Read Rate (GB/s) | Data Read per query (GB) |
|---|---|---|
| 1 | 4.6 | 4 |
| 2 | 11.49 | 6 |
| 3 | 16.37 | 9.2 |
| 4 | 19.64 | 11.9 |
| 5 | 21.9 | 14.9 |
You can switch tiers with a few clicks without losing any data. But if you need any help, we can always provide a proof of concept (POC) on request to find the best solution for your scenario.
Frequently Asked Questions
#
Which protocols can I use to send traces?: In VictoriaMetrics Cloud, VictoriaTraces accepts OTLP over HTTP only, via a single traces endpoint. Self-hosted VictoriaTraces also supports OTLP/gRPC, but that is not available in Cloud at launch.
My exporter is configured for OTLP/gRPC. What do I change?: One line in most cases: switch the otlp exporter to otlphttp and point it at your deployment endpoint. This is the most common setup issue, so check it first if distributed tracing data isn’t arriving. Note that Kubernetes system components (kube-apiserver, kubelet) export OTLP over gRPC on port 4317 by default, so those need an OpenTelemetry Collector in between to receive gRPC and export HTTP.
Which collectors and agents work?: The OpenTelemetry Collector and any distribution of it, Grafana Alloy, and OpenTelemetry SDKs exporting directly from your application with no collector at all. Fluent Bit also works, as its OpenTelemetry output supports traces and is HTTP-only.
Do I need to re-instrument my services?: No. If you already emit OTLP, you change an endpoint. If you’re on Jaeger or Zipkin instrumentation, run the OpenTelemetry Collector with the jaeger or zipkin receiver, and it translates to OTLP on the way out.
Can I correlate traces with my metrics and logs?: Not automatically yet. You can manually correlate distributed tracing data and logs that share attributes, so Grafana’s correlation features can link a trace_id in a log line to the trace, and back again. Automatic cross-signal correlation is on the roadmap. For more details, see the correlation guide.
What are the limitations of VictoriaTraces on VictoriaMetrics Cloud at launch?: The following limitations exist at the time of launch.
- Single-node deployments, without high availability or replication.
- OTLP over HTTP only. No gRPC.
- No user-defined alerting or recording rules for traces (to be supported soon)
How much does it cost? You choose a capacity tier, metered hourly, plus storage and network egress. There’s no charge per span ingested, stored, or queried, and no per-host or per-user fees. The things that move your bill are changing tier and changing retention, both of which you do deliberately.
Can I try it first? Yes. New accounts get $200 in credits to spend over 30 days, no credit card required. We also provide free credits by request to existing Cloud users to test VictoriaTraces.
Leave a comment below or Contact Us if you have any questions!
comments powered by Disqus
You might also like:
What's New in VictoriaMetrics Cloud Q2 2026? Transparent Credits, Navigation Improvements, and a New Path for Cluster Tiers
Q2 2026 brought transparent credits reporting for prepaid billing, many navigation improvements across the console, progress on SOC 2, and a first look at the compute-based model that will reshape how VictoriaMetrics Cluster is sized and priced.
What's New in VictoriaMetrics Cloud Q1 2026? Logs, MCP Server, Better Alerting, and... a Secret Project
Q1 2026 brought VictoriaLogs GA, a hosted MCP Server, a brand new cost calculator, a major expansion of alerting rule presets with a new editor, infrastructure improvements, notifications via generic webhooks and a few things we are cooking.
VictoriaLogs in VictoriaMetrics Cloud: Fast, Cost-Effective Log Management is Here
Announcing VictoriaLogs in VictoriaMetrics Cloud: fast, cost-effective log management with native OpenTelemetry support, LogsQL for powerful analysis, and integrations with Grafana and Perses for complete observability monitoring, is the best option to save costs when compared to other alternatives like ElasticSearch or Datadog.