- Blog /
- Prometheus Alerting 101: Rules, Recording Rules, and Alertmanager
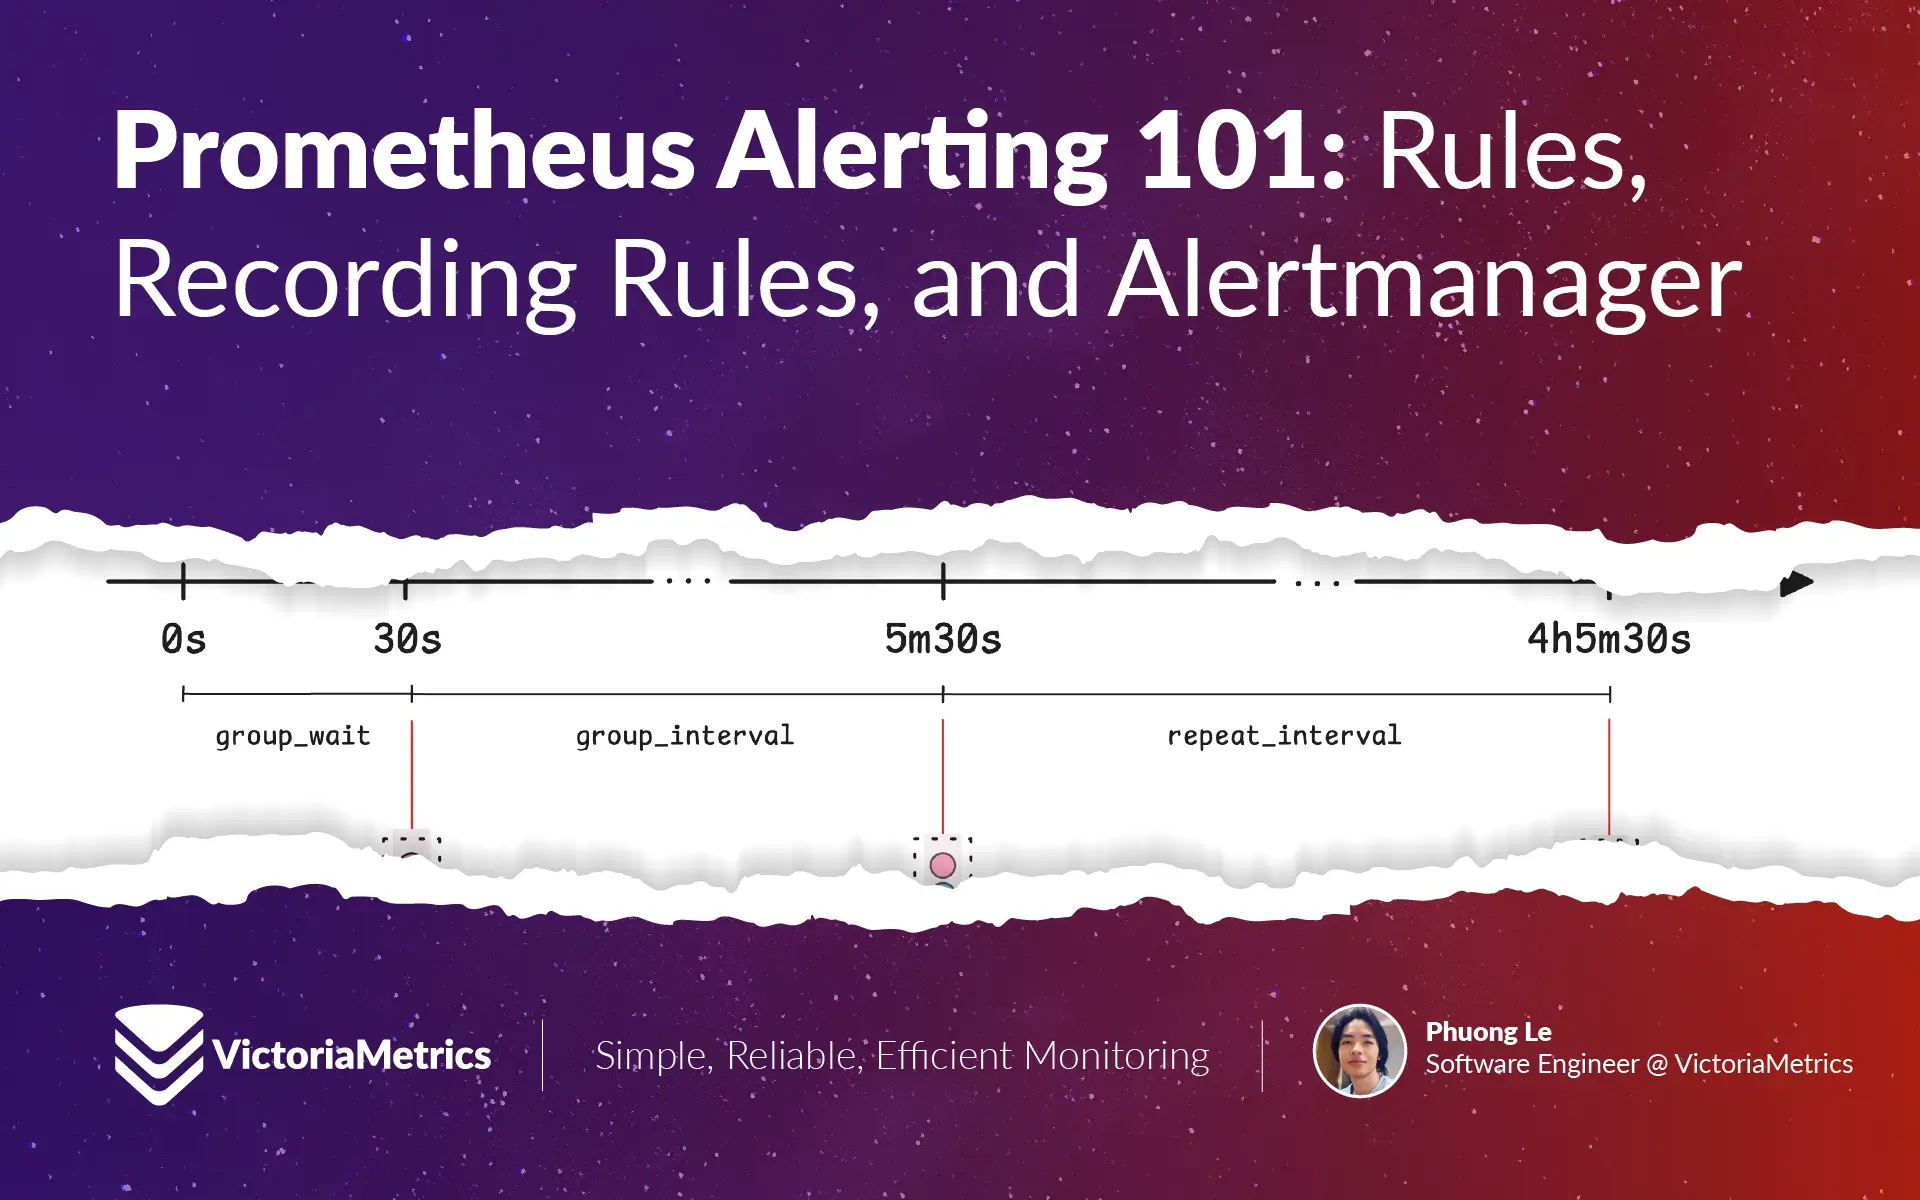
Prometheus Alerting 101: Rules, Recording Rules, and Alertmanager
Share:


This discussion is part of the basic monitoring series, an effort to clarify monitoring concepts for both beginners and experienced users:
- Counters, Gauges, Histograms & Summaries
- Instant Queries and Range Queries Explained
- Functions, Subqueries, Operators, and Modifiers
- Alerting Rules, Recording Rules, and Alertmanager (We’re here)
Rules
#
A rule is an expression that is periodically evaluated against a datasource at a specified interval. The expression is written in a query language (like PromQL, MetricsQL, or LogsQL) and defines what data to retrieve and analyze.
Alerting Rules
#
Alerting rules help spot issues in the system and send alerts when specific conditions are met. These alerts go to the Alertmanager, which takes care of notifying you via email, Slack, or other alert channels.
Let’s say you need an alert when a server’s CPU usage goes over 80% for more than 5 minutes. Here’s what that would look like:
alert: HighCPUUsage
expr: avg by (instance) (rate(cpu_usage[5m])) > 80
for: 5m
labels:
  severity: critical
annotations:
  summary: "High CPU usage detected"
  description: "Instance {{ $labels.instance }} has been using {{ $value }}% CPU for over 5 minutes."
What’s happening here? The expression avg by (instance) (rate(cpu_usage[5m])) > 80 calculates the average CPU usage for each instance over the last 5 minutes and returns only the time series its value is greater than 80.
For example, if you have 10 instances but only 3 have CPU usage over 80%, the query will return just those 3 instances.
Alerting system creates a separate alert for each of those time series, with each alert containing the actual CPU usage value in its {{ $value }} field.
The alert system runs this check periodically. If the CPU stays above 80% for more than 5 minutes (for: 5m), the HighCPUUsage alert kicks in and sends a notification to the Alertmanager:

The Alertmanager then uses labels to organize and route the alert. You might have a team label to indicate who should handle the alert—like db, backend, or security. Based on this, the alert can be sent to the right Slack channel, such as #alert-db-team.
Labels also help with other actions, like muting alerts for certain teams. The annotations section adds more details, like which instance is hitting high CPU and by how much.
Once the CPU usage drops back to normal (the expression evaluates to no time series), the alert system sends a resolved message to the Alertmanager:
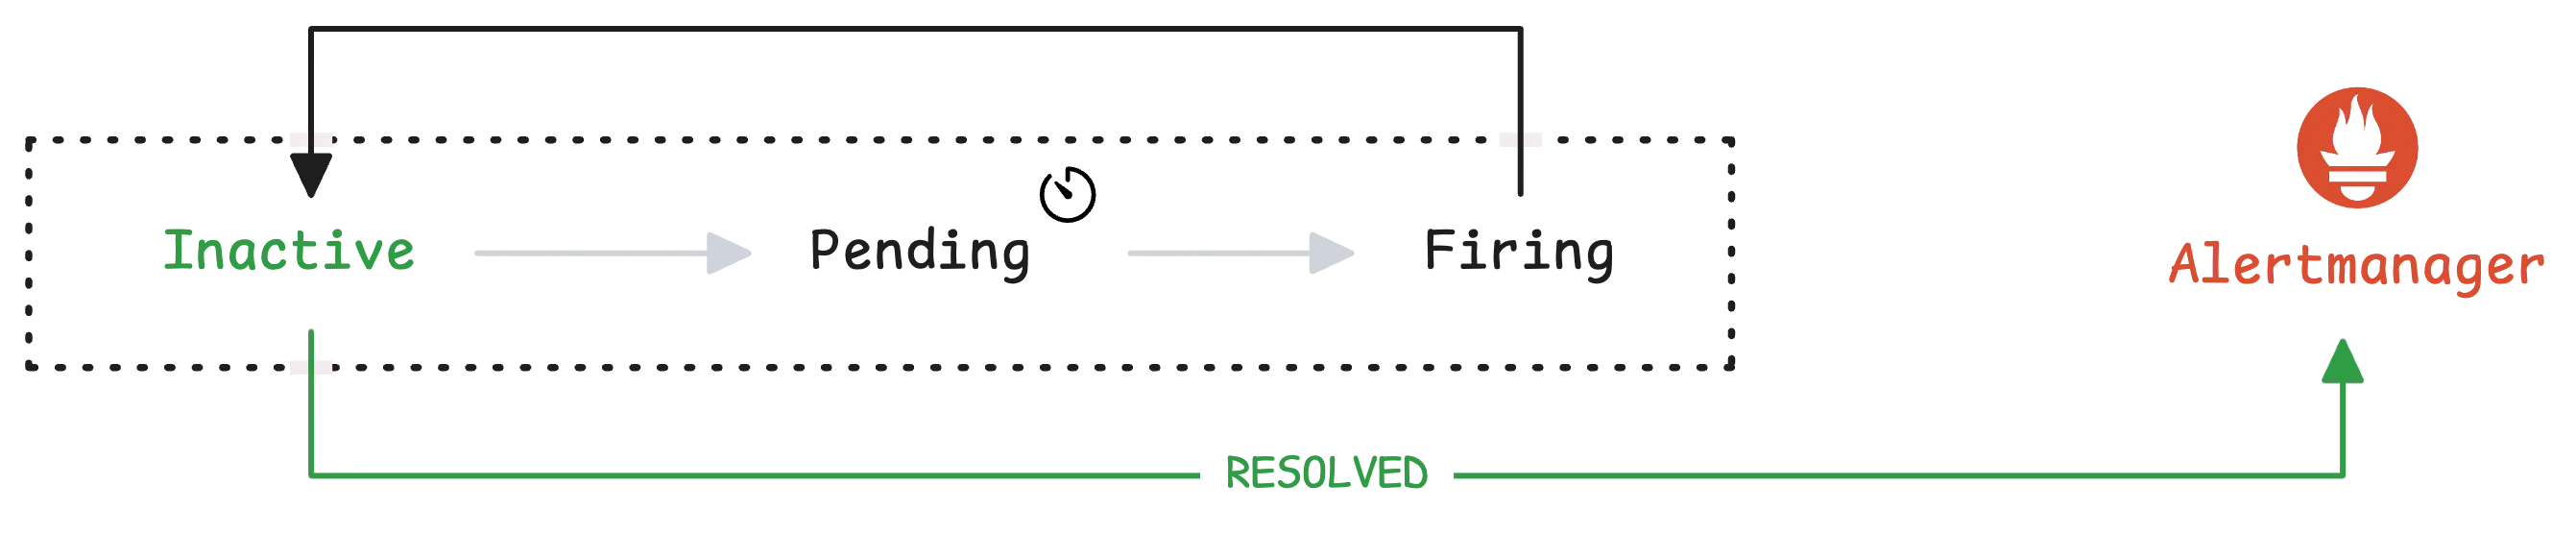
At that point, you’ll get a notification letting you know that everything’s back to normal. But the rule itself doesn’t stop—it continues to be evaluated at regular intervals and you will get notified again if the condition is met.
Of course, there are scenarios where instances have high CPU usage but do not trigger an alert.
Let’s say it lasts for 4 minutes, but at 4:01, the CPU usage drops below 80%. In this case, the alert will deactivate, and nothing will happen:

Recording Rules
#
Recording rules help store the results of frequently used calculations in VictoriaMetrics (or another storage system) using the remote write mechanism. Instead of running the same complex queries over and over, the system calculates the result once and saves it as a new time series.
We already used a query in the previous section to get the average CPU usage per instance. Now, let’s turn that into a recording rule:
record: instance:cpu_usage:avg5m
expr: avg by (instance) (rate(cpu_usage[5m]))
The system runs this query on a regular basis and creates an instant vector that holds the average CPU usage over 5 minutes for each instance. The alert system then writes this vector under the name instance:cpu_usage:avg5m to the monitoring system using the remote write mechanism.
Note
If vectors and queries sound unfamiliar, check out Instant Queries and Range Queries Explained.
Once this time series is stored, it can be used in dashboards or alerts whenever needed, without having to recompute the original query each time.
Templates
#
Templating makes it possible to insert dynamic values into alert messages (annotations). This helps format messages better, reference alert details like labels, values, and timestamps, and even do some basic logic or calculations inside annotations.
Instead of writing a fixed alert message like this:
annotations:
  description: "CPU usage is high."
It’s better to use templating to include meaningful values in the message:
annotations:
  description: "Instance {{ $labels.instance }} has CPU usage
  of {{ $value }}% for {{ $for }} from {{ $activeAt}}."
The template format uses placeholders like {{ $labels.instance }} to dynamically insert the instance name from time series labels, {{ $value }} to show the actual metric value, and {{ $for }} to indicate how long the condition has been active. If {{ $activeAt }} is included, it will show the exact timestamp of when the alert started.
Templates support quite a bit, even including functions like humanize, jsonEscape, and toTime. For a full list, check out the vmalert - Templating.
Groups
#
Earlier, we mentioned that the system runs rules at set intervals, but what actually decides that timing? That would be the group.
A group is a collection of related alerting and recording rules that run together. Each group has a unique name and follows a specific interval. To bring everything together, here’s an example of a CPU monitoring group that checks for high CPU usage and stores calculated averages:
groups:
  - name: cpu-monitoring
    interval: 1m
    rules:
      - record: instance:cpu_usage:avg5m
        expr: avg by (instance) (rate(cpu_usage[5m]))

      - alert: HighCPUUsage
        expr: instance:cpu_usage:avg5m > 80
        for: 5m
        labels:
          severity: critical
        annotations:
          description: "Instance {{ $labels.instance }} has high CPU usage for over 5 minutes."

      - alert: HighCPUOffHours
        expr: (hour() >= 0 and hour() < 6) and instance:cpu_usage:avg5m > 50
        for: 15m
        labels:
            severity: warning
        annotations:
            description: "Instance {{ $labels.instance }} has CPU usage above 50% during off-hours (midnight to 6 AM). Unexpected load detected."
This cpu-monitoring group runs every 1 minute and includes three rules:
- A recording rule that calculates and stores the average CPU usage per instance as
instance:cpu_usage:avg5m. - An alerting rule that triggers if CPU usage stays above 80% for more than 5 minutes.
- Another alert that watches for unusually high CPU usage during expected low-usage hours (midnight to 6 AM).
So, what makes groups useful?
One big advantage is controlling when rules run. Each group has its own evaluation interval, deciding how often the system checks the rules inside it. By default, the rules in a group run one after the other.
Sometimes, these rules take too much time to run sequentially and may even exceed the evaluation interval. In this case, it’s better to run them in parallel by adding the concurrency parameter:
groups:
  - name: cpu-monitoring
    interval: 1h
    concurrency: 10
The evaluation time will be aligned with the groups interval (unless eval_alignment: false). For example, if the interval is set to 1 hour, the group runs at the start of each hour (e.g. 01:00, 02:00, 03:00).
But if it needs to run at the half-hour mark instead, the eval_offset parameter can be adjusted:
groups:
  - name: cpu-monitoring
    interval: 1h
    eval_offset: 30m
With this setting, the rules in the group will always execute at the 30th minute of each hour (e.g. 01:30, 02:30, 03:30, and so on). More details on configuration options are available in the vmalert - Groups.
Alertmanager
#
Alertmanager takes care of handling, processing, and delivering alerts from vmalert. Instead of bombarding engineers with a separate notification for every alert, it groups, deduplicates, silences, and routes them to keep things under control.
Routing
#
When an alert reaches Alertmanager, it goes through a routing process to decide where it should go based on its labels. The routing tree helps determine which receiver gets the alert:
route:
  receiver: 'team-email'
  routes:
  - receiver: 'engineer-pager'
    matchers:
      - severity="critical"
    continue: true
  - receiver: 'team-leader-pager'
    matchers:
      - severity="critical"
      - priority="high"
The setup above includes 3 channels for sending alerts. The default receiver is team-email, while engineer-pager and team-leader-pager handle specific cases:
- Alerts labeled
severity="critical"go to the on-call engineer. - If an alert is both
severity="critical"andpriority="high", it also goes to the team leader. - Any alert that doesn’t match these conditions lands in
team-emailas a fallback.
A key thing to notice is the continue: true line. Without it, high-priority critical alerts wouldn’t reach the team leader because the first rule would already capture them.
Grouping & Deduplication
#
Once alerts are routed, they are grouped to avoid unnecessary noise. Instead of sending separate notifications for 50 failing servers, it bundles them into a single message, like “50 servers have high CPU usage: server-1 (99%), server-2 (100%), server-3 (96%),…”
Alerts that share the same grouping labels are combined into one notification:
route:
  group_by: ['alertname']
  group_wait: 30s
  group_interval: 5m
  repeat_interval: 4h
  receiver: operations-email
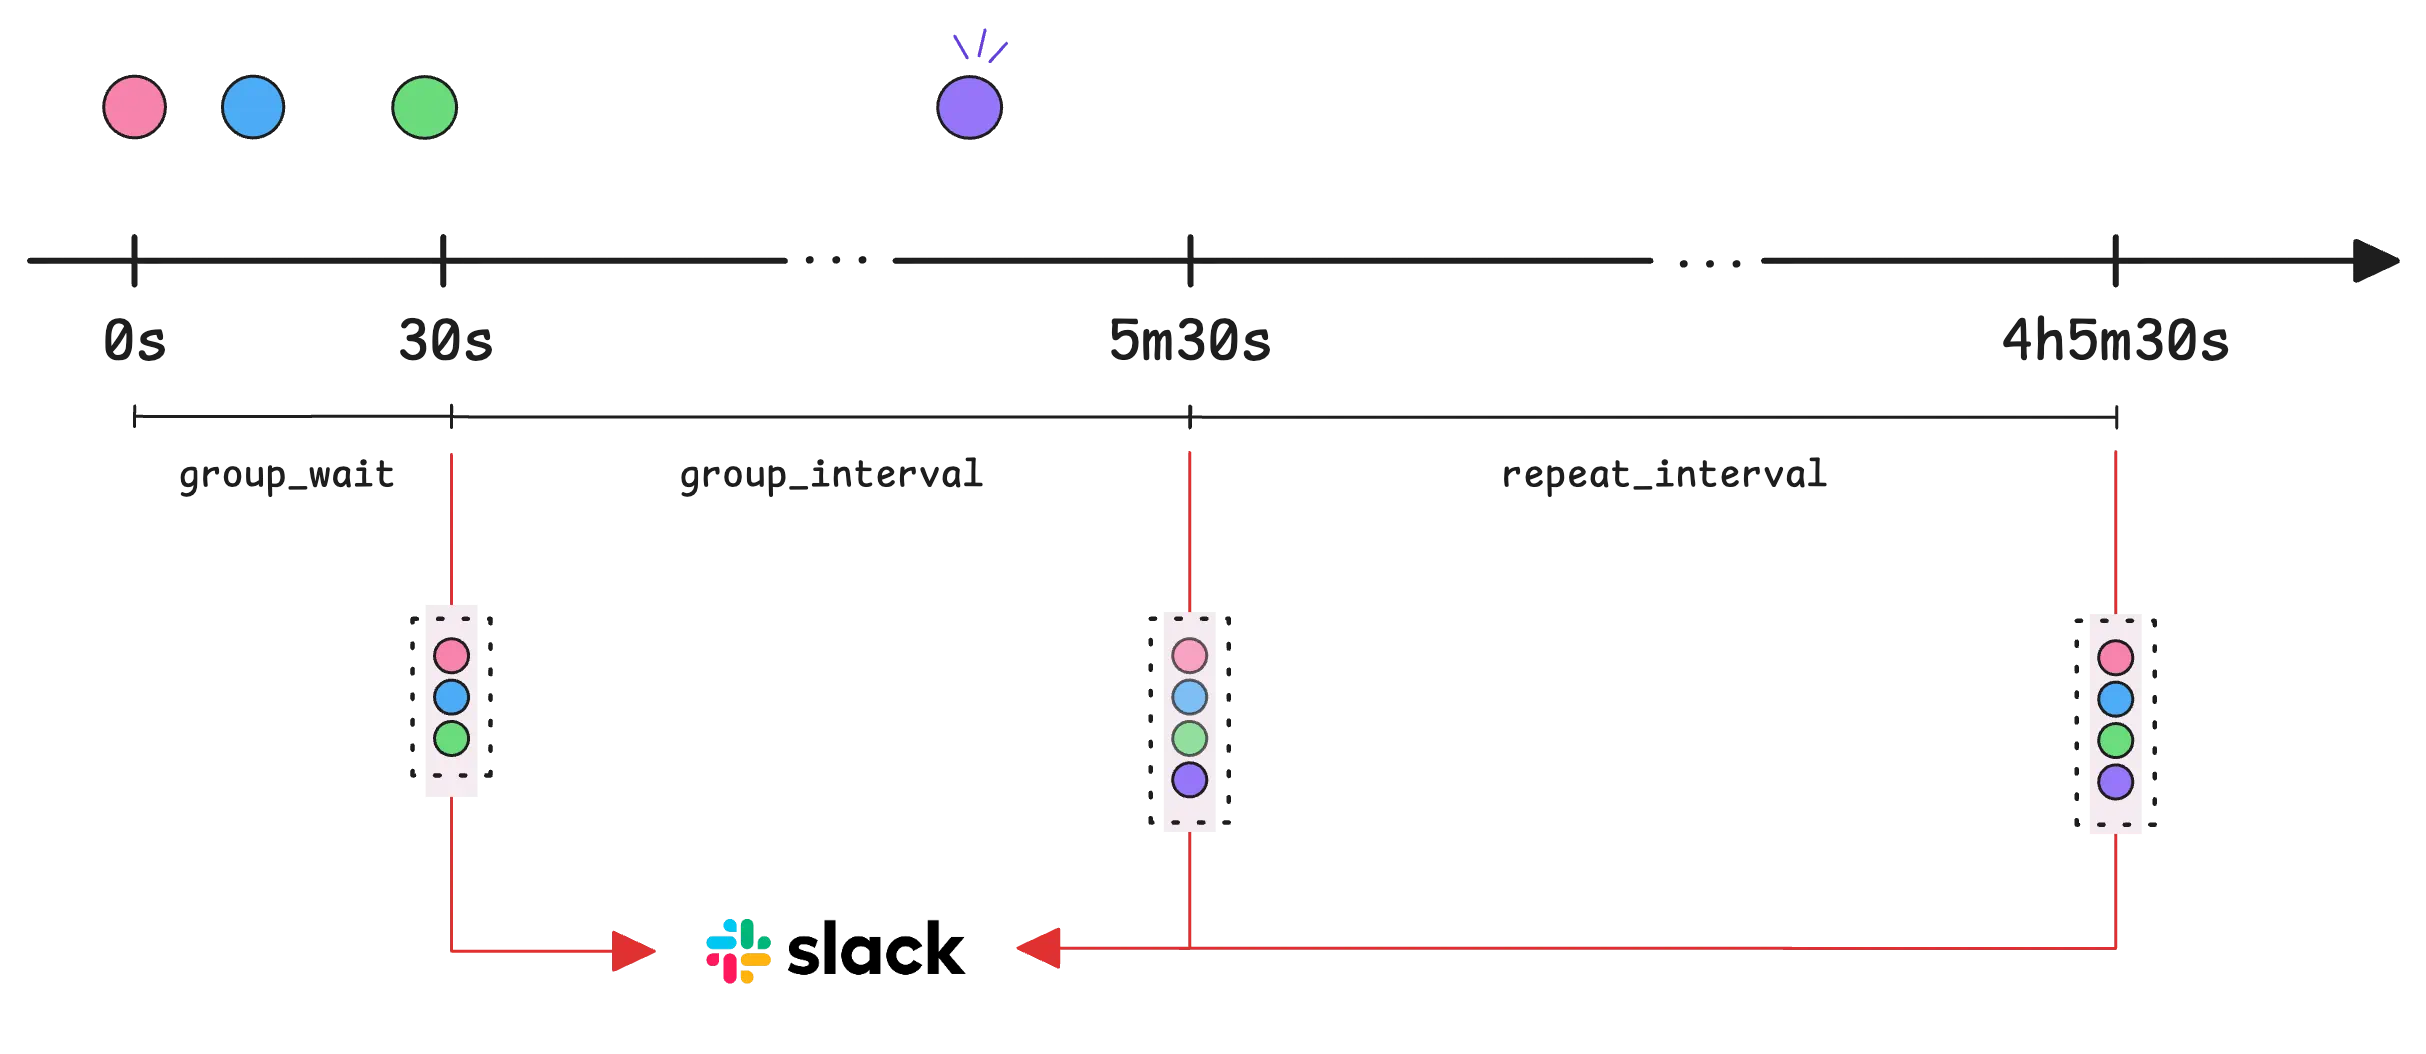
This route groups alerts by name (like HighCPUUsage) so they are sent together. When a new alert appears, Alertmanager doesn’t immediately send a notification. Instead, it waits 30 seconds (group_wait) to collect any additional alerts before sending the first notification.
Once the first notification goes out after 30 seconds, Alertmanager checks for updates every 5 minutes (group_interval).
If new alerts are added or existing ones are resolved, another notification is sent. If nothing changes for 4 hours (repeat_interval), it resends the last notification as a reminder:
Note: The difference between ‘group_interval’ and ‘repeat_interval’
group_intervalsets how often Alertmanager checks for new or resolved alerts within a notification cycle—at 5m30s, 10m30s, 15m30s, and so on. If there’s a change, it sends an update.repeat_intervalworks a bit differently. It ensures that even if nothing changes, the alert is resent every 4 hours, from the last time it was sent.
Grouping can also be fine-tuned by adding child routes:
route:
group_by: ['alertname']
...
routes:
- matchers:
- severity="critical"
receiver: sre-pager
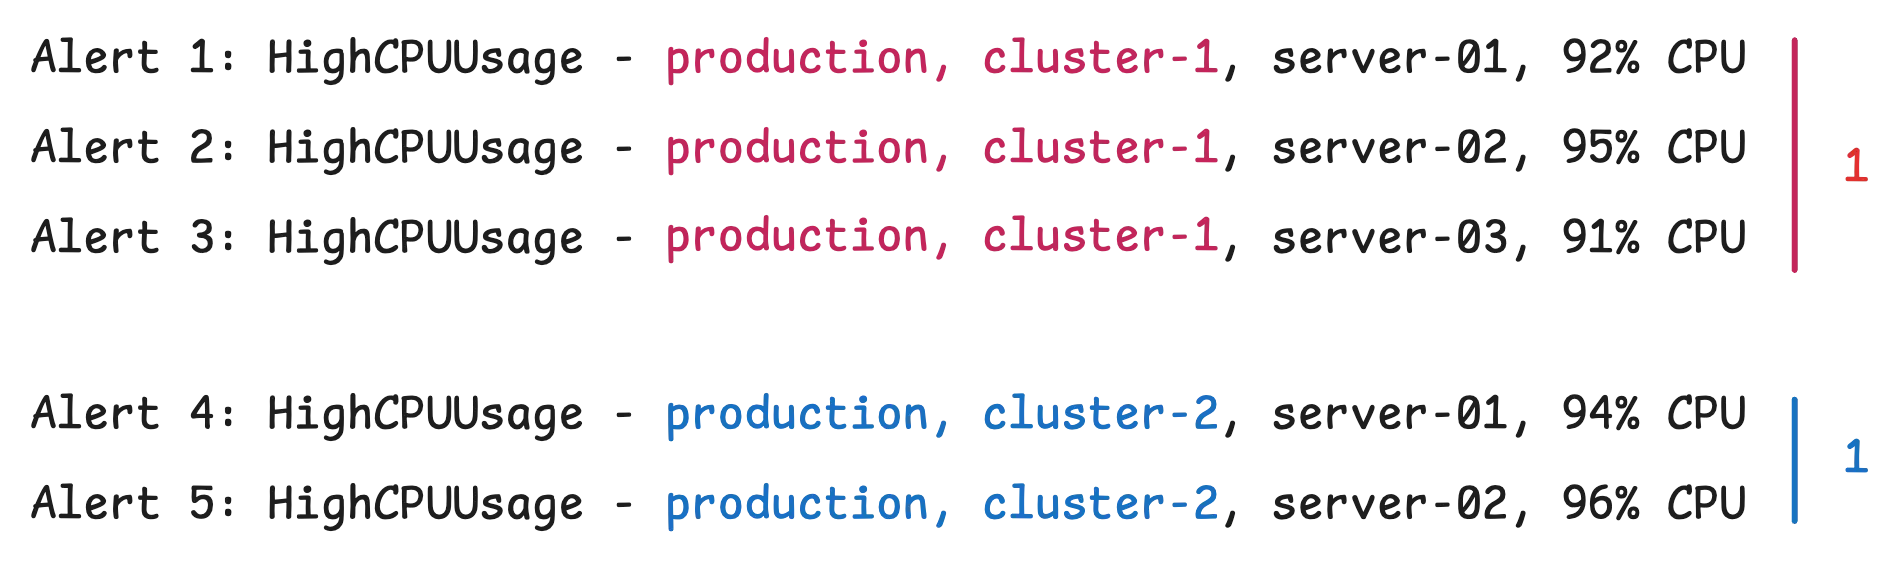
group_by: ['environment', 'cluster']
This setup further breaks alerts down by environment and cluster, making it easier to pinpoint where issues are happening:
Inhibition
#
After deduplication, alerts go through inhibition. This step checks whether an alert should be suppressed based on the presence of other, more important alerts.
An inhibited alert isn’t gone—it still appears in the Alertmanager UI—but it won’t trigger a notification because it’s considered a symptom of a bigger problem. And that bigger problem is already notified.
Another common example is suppressing alerts for dependent services:
inhibit_rules:
  - source_match:
      service: 'kafka_producer'
    target_match:
      service: 'kafka_consumer'
    equal: ['environment', 'topic']
If a Kafka producer has issues, alerts from the Kafka consumer for the same environment and topic will be ignored temporarily. This keeps notifications focused on the root cause instead of flooding engineers with follow-up failures.
Silencing
#
Silencing mutes notifications for specific alerts without changing alert rules or configurations. Silences are usually applied through the Alertmanager UI, API, or the command-line tool (amtool).
Each silence includes:
- Matchers that define which alerts to mute
- A start time and an end time
- A comment explaining why it was created
- The name of the person who set it
To silence all HighCPUUsage alerts between 15:00 and 17:00, use this:
curl -X POST -H "Content-Type: application/json" -d '{
  "matchers": [
    {
      "name": "alertname",
      "value": "HighCPUUsage",
      "isRegex": false,
      "isEqual": true
    }
  ],
  "startsAt": "2023-05-01T15:00:00Z",
  "endsAt": "2023-05-01T17:00:00Z",
  "createdBy": "phuong.le",
  "comment": "Silencing during scheduled maintenance"
}' http://alertmanager:9093/api/v2/silences
Sending Notifications
#
This step handles delivering alerts to external systems and managing any failures along the way.
By now, Alertmanager has already processed, filtered, and grouped the alerts. The system knows which receiver should get the notification, whether that’s an email, a Slack channel, or a PagerDuty service.
Alertmanager also uses templates to format messages properly. Earlier, templates were used in alerting rules to customize annotations. There’s also a template in the Alertmanager config that shapes the final notification:
receivers:
  - name: 'slack'
    slack_configs:
      - channel: '#alerts'
        title: '{{ .CommonAnnotations.summary }}'
        text: |
          {{ if .CommonAnnotations.description }}*Description:* {{ .CommonAnnotations.description }}{{ end }}
          {{ if .CommonAnnotations.runbook }}*Runbook:* {{ .CommonAnnotations.runbook }}{{ end }}
Notifications are separated into ‘firing’ and ‘resolved’ alerts.
When sending out messages, Alertmanager organizes alerts into these two categories. The template can then use .Alerts.Firing and .Alerts.Resolved to include this information in messages.
Whether resolved alerts are included depends on the receiver’s configuration. Each receiver has a send_resolved setting that controls this:
receivers:
  - name: 'slack'
    slack_configs:
      - channel: '#alerts'
        send_resolved: true
Most services will send notifications when alerts are resolved, but some won’t:
- Defaults to
true: Discord, Email, PagerDuty, Slack, Telegram - Defaults to
false: Webhook, VictorOps, Jira
One last thing—when an alert is resolved, Alertmanager won’t immediately send a notification. It waits until the next notification cycle, based on the group_interval.
Who We Are
#
We provide a cost efficient, scalable monitoring and logging solution that most users are happy with. Check out VictoriaMetrics for more information.
If you spot anything that’s outdated or if you have questions, don’t hesitate to reach out. You can drop me a DM on X(@func25).
Leave a comment below or Contact Us if you have any questions!
comments powered by Disqus