- Blog /
- AI Agents Observability with OpenTelemetry and the VictoriaMetrics Stack
AI Agents Observability with OpenTelemetry and the VictoriaMetrics Stack
Share:


Introduction
#
Nowadays, AI agents are becoming more and more popular and often deployed as part of production systems. However, this rapid adoption brings unique observability challenges that require flexible solutions.
On the one hand, AI agents are fundamentally just like any other software services that produce the same classic observability signals we’re familiar with: metrics, logs, and traces. On the other hand, they introduce a few important differences that make observability for AI agents both challenging and interesting:
Developer Experience Gap
The AI boom has attracted talent from data science, research, and product development backgrounds. Many of these brilliant minds may not have extensive software engineering experience, let alone understand the nuances of distributed systems observability. A lot of AI agents can even be generated by no-code or vibe coding tools.
Interaction-Centric Architecture
AI agents’ logic often forms a complex workflow: orchestration, chain of thought, tool usage, memory and vector databases queries, and interactions with other systems or models. The large number of interactions, with an emphasis on speed and cost, makes distributed tracing the primary observability signal for understanding an agent’s “thought process”; rather than traditional metrics and logs.
Rapid Evolution
The AI agent ecosystem is evolving at an unprecedented pace, with new models, tools, and frameworks appearing weekly or even daily. It’s critical to have observability solutions capable of quickly adapting to this rapid pace of change.
Framework Diversity
The ecosystem is exploding with numerous frameworks and libraries for building AI agents. But fortunately, despite the variety of tools, they operate with similar entities and follow surprisingly uniform patterns and approaches in how agents are orchestrated and how they interact with LLMs, vector databases, and external tools.
This is the perfect scenario for a standardized solution that is both powerful and easy to implement – this combination of factors makes OpenTelemetry auto-instrumentation an ideal solution for AI agents. It enables developers to quickly add comprehensive observability to their AI agents with minimal code changes and no need to worry about low-level details.
When paired with the VictoriaMetrics Stack (VictoriaMetrics + VictoriaLogs + VictoriaTraces), you get a complete observability platform that excels at collecting, storing, and analyzing all signals from your AI agents – including the recently added trace support. It provides a high-performance, cost-efficient observability platform that integrates natively with OpenTelemetry, and scales from small projects to huge deployments.
The result is a powerful combination:
- OpenTelemetry abstracts away implementation details in your library, requiring just a few lines of configuration code,
- while the VictoriaMetrics Stack provides outstanding performance for observability.
This approach not only enables signal collection and analysis but also integrates seamlessly with other tools and platforms, making your observability infrastructure more powerful and flexible.
Let’s explore how you can quickly start collecting all signals from your AI agents using OpenTelemetry and the VictoriaMetrics Stack across popular frameworks and libraries.
Environment Setup
#
Let’s check out how it all fits together.
Our observability architecture will be straightforward:
AI agents
Our swarm of existing AI agents, built with various technologies. In this article, we will look at how to enable automatic instrumentation for them – automatically capture observability signals with just a few lines of code. This approach can be applied for any service, but in this article we will focus only on AI agents.
OpenTelemetry Collector
A central component that receives signals from all agents, normalizes, processes them, and forwards them to the VictoriaMetrics Stack.
the VictoriaMetrics Stack
Our all-in-one observability backend that stores and analyzes all signals. It consists of:
- VictoriaMetrics: For storing and querying time-series metrics
- VictoriaLogs: For efficient log storage and analysis
- VictoriaTraces: For storing and exploring distributed traces
Grafana
Visualizes all observability signals in unified dashboards.

AI Agents Observability Architecture
Now it’s time to set it all up.
We are going to consider two options:
You can get this entire stack running in minutes using either Docker Compose or Helm.
This article contains only minimal demo configs. For a real production environment you will need extra configuration for the VictoriaMetrics Stack components and otel-collector.
Installation With Docker Compose
#
Save this file as docker-compose.yml:
# docker-compose.yml

services:

  otel-collector:
    image: ghcr.io/open-telemetry/opentelemetry-collector-releases/opentelemetry-collector-contrib:0.133.0
    command: [ "--config=/etc/otel-collector-config.yml" ]
    ports: [ "4317:4317", "4318:4318" ]
    configs: [ { source: "otel-collector-config", target: "/etc/otel-collector-config.yml", mode: 0444 } ]

  victoriametrics:
    image: victoriametrics/victoria-metrics:v1.128.0
    ports: [ "8428:8428" ]
    command: [ "--storageDataPath=/storage", "--opentelemetry.usePrometheusNaming=true" ]
    volumes: [ "vmdata:/storage" ]

  victorialogs:
    image: victoriametrics/victoria-logs:v1.36.1
    ports: [ "9428:9428" ]
    command: [ "--storageDataPath=/vlogs" ]
    volumes: [ "vldata:/vlogs" ]

  victoriatraces:
    image: victoriametrics/victoria-traces:v0.4.0
    ports: [ "10428:10428" ]
    command: [ "--storageDataPath=/vtraces", "--servicegraph.enableTask=true" ]
    volumes: [ "vtdata:/vtraces" ]

  grafana:
    image: grafana/grafana:12.2.0
    ports: [ "3000:3000" ]
    volumes: [ "grdata:/var/lib/grafana" ]
    environment:
      - "GF_INSTALL_PLUGINS=victoriametrics-metrics-datasource,victoriametrics-logs-datasource"
    configs:
      - { source: "victoriametrics-datasource", target: "/etc/grafana/provisioning/datasources/victoriametrics.yml", mode: 0444 }
      - { source: "victoriatraces-datasource", target: "/etc/grafana/provisioning/datasources/victoriatraces.yml", mode: 0444 }
      - { source: "victorialogs-datasource", target: "/etc/grafana/provisioning/datasources/victorialogs.yml", mode: 0444 }

configs:
  otel-collector-config:
    content: |
      receivers:
        otlp:
          protocols:
            http:
              endpoint: "otel-collector:4318"
              cors:
                allowed_origins: [ "http://*", "https://*" ]
      exporters:
        otlphttp/victoriametrics:
          endpoint: "http://victoriametrics:8428/opentelemetry"
          tls:
            insecure: true
        otlphttp/victorialogs:
          logs_endpoint: "http://victorialogs:9428/insert/opentelemetry/v1/logs"
          tls:
            insecure: true
        otlphttp/victoriatraces:
          traces_endpoint: "http://victoriatraces:10428/insert/opentelemetry/v1/traces"
          tls:
            insecure: true
      service:
        pipelines:
          traces: { receivers: [ otlp ], exporters: [ otlphttp/victoriatraces ] }
          metrics: { receivers: [ otlp ], exporters: [ otlphttp/victoriametrics ] }
          logs: { receivers: [ otlp ], exporters: [ otlphttp/victorialogs ] }
  victoriametrics-datasource:
    content: |
      apiVersion: 1
      datasources:
        - name: VictoriaMetrics
          type: victoriametrics-metrics-datasource
          access: proxy
          url: http://victoriametrics:8428
          isDefault: true
  victorialogs-datasource:
    content: |
      apiVersion: 1
      datasources:
        - name: VictoriaLogs
          type: victoriametrics-logs-datasource
          access: proxy
          url: http://victorialogs:9428
  victoriatraces-datasource:
    content: |
      apiVersion: 1
      datasources:
        - name: VictoriaTraces
          type: jaeger
          access: proxy
          url: http://victoriatraces:10428/select/jaeger

volumes:
  vmdata: {}
  vldata: {}
  vtdata: {}
  grdata: {}
And run:
docker-compose -f docker-compose.yml up
Installation With Helm
#
- Add the Helm repositories:
helm repo add vm https://victoriametrics.github.io/helm-charts/
helm repo add open-telemetry https://open-telemetry.github.io/opentelemetry-helm-charts
helm repo add grafana https://grafana.github.io/helm-charts
helm repo update
- Install the VictoriaMetrics Stack:
helm install vms vm/victoria-metrics-single \
  --create-namespace --namespace=monitoring-demo \
  --set "server.extraArgs.opentelemetry\.usePrometheusNaming=true"
helm install vts vm/victoria-traces-single \
  --create-namespace --namespace=monitoring-demo \
  --set "server.extraArgs.servicegraph\.enableTask=true"
helm install vls vm/victoria-logs-single \
  --create-namespace --namespace=monitoring-demo
- Save to
otel-collector-values.yamlfile the following parameters:
# otel-collector-values.yaml

mode: "statefulset"
image:
  repository: "ghcr.io/open-telemetry/opentelemetry-collector-releases/opentelemetry-collector-k8s"
command:
  name: "otelcol-k8s"
config:
  extensions:
    health_check:
      endpoint: ${env:MY_POD_IP}:13133
  receivers:
    otlp:
      protocols:
        http:
          endpoint: ${env:MY_POD_IP}:4318
  exporters:
    otlphttp/victoriametrics:
      endpoint: "http://vms-victoria-metrics-single-server:8428/opentelemetry"
      tls:
        insecure: true
    otlphttp/victorialogs:
      logs_endpoint: "http://vls-victoria-logs-single-server:9428/insert/opentelemetry/v1/logs"
      tls:
        insecure: true
    otlphttp/victoriatraces:
      traces_endpoint: "http://vts-vt-single-server:10428/insert/opentelemetry/v1/traces"
      tls:
        insecure: true
  service:
    extensions:
      - health_check
    pipelines:
      traces: { receivers: [ otlp ], exporters: [ otlphttp/victoriatraces ] }
      metrics: { receivers: [ otlp ], exporters: [ otlphttp/victoriametrics ] }
      logs: { receivers: [ otlp ], exporters: [ otlphttp/victorialogs ] }
- Install the OpenTelemetry Collector helm-chart:
helm install otel-collector open-telemetry/opentelemetry-collector \
  --create-namespace --namespace=monitoring-demo \
  -f otel-collector-values.yaml
- Save to
grafana-values.yamlfile the following parameters:
# grafana-values.yaml

plugins:
  - victoriametrics-metrics-datasource
  - victoriametrics-logs-datasource

datasources:
  datasources.yaml:
    apiVersion: 1
    datasources:
      - name: VictoriaMetrics
        type: victoriametrics-metrics-datasource
        access: proxy
        url: http://vms-victoria-metrics-single-server:8428
        isDefault: true
      - name: VictoriaLogs
        type: victoriametrics-logs-datasource
        access: proxy
        url: http://vls-victoria-logs-single-server:9428
      - name: VictoriaTraces
        type: jaeger
        access: proxy
        url: http://vts-vt-single-server:10428/select/jaeger
- Install the Grafana helm-chart:
helm install grafana grafana/grafana \
  --create-namespace --namespace=monitoring-demo \
  -f grafana-values.yaml
AI Agents libraries and frameworks landscape
#
Before diving into instrumentation, let’s take a look at the popular frameworks and libraries for AI agent development.
We’ll categorize them into:
Libraries and frameworks
#
In this article, we will focus just on the Python ecosystem.
- OpenAI
- Anthropic SDK
- Google Vertex AI
- LangChain
- LangGraph
- CrewAI
- Ollama
- AutoGen
- Pydantic AI
- OpenAI Agents
- HuggingFace Transformers
- LlamaIndex
- Google GenAI SDK
- Haystack
- AWS Bedrock
- HuggingFace Smolagents
- Cohere
- Google ADK
- LiteLLM
- LangFlow
- Groq SDK
- Replicate
- Agno
- DSPy
- Mistral AI
- Instructor
- Together AI
- BeeAI
- AG2
- Dynamiq
- Mem0
- Letta
- Portkey AI
- Guardrails AI
- A21
- AssemblyAI
- Browser Use
- Crawl4AI
- ElevenLabs
- FireCrawl
- GPT4All
- Julep
- vLLM
- SwarmZero
Vector Databases
#
AI agents often require integration with vector databases for semantic search and RAG (Retrieval-Augmented Generation):
Protocols and Standards
#
To keep this list from getting even longer, I will mention only the two most important things:
- OpenTelemetry semantic conventions – a common set of (semantic) attributes which provide meaning to observability data when collecting, producing and consuming it.
- Model Context Protocol (MCP) – a promising standard for AI-agent interoperability. You can learn more about MCP in the context of observability from our video: How to Use an AI Assistant with Your Monitoring System – VictoriaMetrics MCP Server.
OpenTelemetry Auto-Instrumentation
#
This was an impressive list – there are a lot of libraries, frameworks, and interactions that should be instrumented. Covering each individually would make this article enormous.
Fortunately, there’s a way to cover all these libraries and frameworks with just a few lines of code – there are auto-instrumentation projects that cover most of them at once.
Several excellent open-source projects provide automatic instrumentation for popular AI libraries and frameworks using OpenTelemetry:
These projects follow the OpenTelemetry Semantic Conventions, particularly the Semantic Conventions for Generative AI Systems. This standardization ensures consistent data formats across different libraries, thereby simplifying analysis, visualization, and dashboard reuse.
These libraries integrate with OpenTelemetry, emit traces/logs/metrics using AI semantic conventions, and work across frameworks like LangChain, OpenAI, Anthropic, Vertex AI, and others.
Let’s see how these libraries compare in terms of ecosystem coverage.
Feature Support Comparison
#
While all these libraries are excellent, their coverage of the vast AI ecosystem varies. Here is a comparative analysis at the time of writing.
Disclaimer: This ecosystem is moving incredibly fast! Always check the official documentation for the most up-to-date support.
Here’s a comparison of feature support across the three main instrumentation tools.
Libraries
#
| Library | OpenLLMetry | OpenInference | OpenLIT |
|---|---|---|---|
| OpenAI | ✅ | ✅ | ✅ |
| Anthropic SDK | ✅ | ✅ | ✅ |
| Google Vertex AI | ✅ | ✅ | ✅ |
| Ollama | ✅ | ❌ | ✅ |
| AutoGen | ❌ | ✅ | ❌ |
| Pydantic AI | ❌ | ✅ | ✅ |
| HuggingFace Transformers | ✅ | ❌ | ✅ |
| Google GenAI SDK | ✅ | ✅ | ❌ |
| AWS Bedrock | ✅ | ✅ | ✅ |
| HuggingFace Smolagents | ❌ | ✅ | ❌ |
| Cohere | ✅ | ❌ | ✅ |
| Google ADK | ❌ | ✅ | ❌ |
| Groq SDK | ✅ | ✅ | ✅ |
| Replicate | ✅ | ❌ | ❌ |
| Agno | ❌ | ✅ | ✅ |
| Mistral AI | ✅ | ✅ | ✅ |
| Instructor | ❌ | ✅ | ❌ |
| Together AI | ✅ | ❌ | ✅ |
| BeeAI | ❌ | ✅ | ❌ |
| Portkey AI | ❌ | ✅ | ❌ |
| A21 | ❌ | ❌ | ✅ |
| AssemblyAI | ❌ | ❌ | ✅ |
| Browser Use | ❌ | ❌ | ✅ |
| ElevenLabs | ❌ | ❌ | ✅ |
| GPT4All | ❌ | ❌ | ✅ |
| vLLM | ❌ | ❌ | ✅ |
Frameworks
#
| Framework | OpenLLMetry | OpenInference | OpenLIT |
|---|---|---|---|
| LangChain | ✅ | ✅ | ✅ |
| LangGraph | ✅ | ❌ | ❌ |
| LlamaIndex | ✅ | ✅ | ✅ |
| Haystack | ✅ | ✅ | ✅ |
| LiteLLM | ✅ | ✅ | ✅ |
| CrewAI | ✅ | ✅ | ✅ |
| OpenAI Agents | ✅ | ✅ | ✅ |
| LangFlow | ✅ | ❌ | ❌ |
| Guardrails AI | ❌ | ✅ | ✅ |
| DSPy | ❌ | ✅ | ✅ |
| AG2 | ❌ | ❌ | ✅ |
| Dynamiq | ❌ | ❌ | ✅ |
| Mem0 | ❌ | ❌ | ✅ |
| Julep | ❌ | ❌ | ✅ |
| Crawl4AI | ❌ | ❌ | ✅ |
| FireCrawl | ❌ | ❌ | ✅ |
| Letta | ❌ | ❌ | ✅ |
| SwarmZero | ❌ | ❌ | ✅ |
Vector Databases
#
| Database | OpenLLMetry | OpenInference | OpenLIT |
|---|---|---|---|
| Chroma | ✅ | ❌ | ✅ |
| Pinecone | ✅ | ❌ | ✅ |
| Qdrant | ✅ | ❌ | ✅ |
| Weaviate | ✅ | ❌ | ❌ |
| Milvus | ✅ | ❌ | ✅ |
| Marqo | ✅ | ❌ | ❌ |
| LanceDB | ✅ | ❌ | ❌ |
| AstraDB | ❌ | ❌ | ✅ |
Protocols And Standards
#
| Protocol/Standard | OpenLLMetry | OpenInference | OpenLIT |
|---|---|---|---|
| Model Context Protocol (MCP) | ✅ | ✅ | ✅ |
| OpenTelemetry Semantic Conventions | ✅ | ✅ | ✅ |
Languages
#
| Language | OpenLLMetry | OpenInference | OpenLIT |
|---|---|---|---|
| Python | ✅ | ✅ | ✅ |
| JS | ✅ | ✅ | ✅ |
| Go | ✅ | ❌ | ❌ |
| Ruby | ✅ | ❌ | ❌ |
| Java | ❌ | ✅ | ❌ |
Signals
#
| Language | OpenLLMetry | OpenInference | OpenLIT |
|---|---|---|---|
| Traces | ✅ | ✅ | ✅ |
| Metrics | ✅ | ❌ | ✅ |
| Logs | ✅ | ❌ | ❌ |
Instrumenting AI Agents
#
Now let’s look at how to instrument your AI agents using the three main auto-instrumentation libraries.
All of them focus on capturing the semantics that matter for agents: prompt/response bodies, token counts, model metadata, cost attributes, and relevant tool spans – without forcing teams to do it manually.
In the next sections, we will examine everything using the example of a simple python LLM application based on OpenAI:
import logging
import os
from time import sleep

from openai import OpenAI

client = OpenAI(
    api_key=os.environ.get("OPENAI_API_KEY"),
    base_url=os.environ.get("OPENAI_BASE_URL"),
)

def get_random_joke():
    completion = client.chat.completions.create(
        model=os.environ.get("OPENAI_MODEL"),
        messages=[
            { "role": "system", "content": "You are a stand up comedian" },
            { "role": "user", "content": "Tell me a random joke" },
        ],
    )
    return completion.choices[0].message.content

if __name__ == "__main__":
    while True:
        joke = get_random_joke()
        logging.info(f'\n---\n{joke}\n---\n')
        sleep(10)
It’s a simple Python script that generates a random joke every 10 seconds using the OpenAI API.
Using OpenLLMetry
#
Let’s start with OpenLLMetry.
OpenLLMetry is an open source library that helps you to easily start monitoring and debugging your AI applications. Instrumentation works in a non-intrusive way because it is built on top of OpenTelemetry.
It supports collecting all three basic observability signals: traces, metrics, and logs (disabled by default but can be enabled with only one parameter) and wraps a large catalog of OpenTelemetry instrumentations for LLM providers, vector databases, orchestrators, and agent frameworks.
The Python implementation of OpenLLMetry is provided via the traceloop-sdk package.
You can install it with pip:
pip install traceloop-sdk
In your application, initialize the Traceloop (OpenLLMetry) tracer in the following way (only the two highlighted lines are added compared to the original code):
import logging
import os
from time import sleep

from openai import OpenAI

from traceloop.sdk import Traceloop
Traceloop.init(app_name="random_joke_generator")

# ... the rest of the code is the same ...
This library also allows you to enrich the code with your own spans in addition to those created automatically by auto-instrumentation.
You can use special decorators (workflow, task, agent, tool) for this, for example:
import logging
import os
from time import sleep

from openai import OpenAI

from traceloop.sdk import Traceloop
from traceloop.sdk.decorators import workflow

Traceloop.init(app_name="random_joke_generator")

client = OpenAI(
    api_key=os.environ.get("OPENAI_API_KEY"),
    base_url=os.environ.get("OPENAI_BASE_URL"),
)

@workflow("generate_joke")
def print_random_joke():
# ... the rest of the code is the same ...
After adding auto-instrumentation to your code, to send data to the OpenTelemetry Collector you need to set the following environment variables when starting the application:
# Enable sending of logs to the OpenTelemetry collector:
export TRACELOOP_LOGGING_ENABLED=true

# URL to the OpenTelemetry collector:
export TRACELOOP_BASE_URL="http://otel-collector-opentelemetry-collector.monitoring-demo.svc.cluster.local:4318"

# OpenLLMetry collects anonymous usage information by default, you can opt out of telemetry by setting:
export TRACELOOP_TELEMETRY=false
Once configured, your application will now send traces, metrics, and logs and you can see them in Grafana.
In addition to Python and JavaScript versions, this library also supports Go and Ruby (in beta).
Using OpenInference
#
Let’s try the next library: OpenInference.
It’s a set of conventions and plugins that is complementary to OpenTelemetry to enable tracing of AI applications.
It’s built to give visibility into how LLMs are invoked and to capture the broader application context – including actions like retrieving data from vector stores or using external tools such as search engines and APIs. The library is transport and file-format agnostic and is intended to be used in conjunction with other specifications such as JSON, ProtoBuf, and DataFrames.
Currently, the library only supports collecting traces (without metrics and logs).
Unlike OpenLLMetry, here you have to choose the package to install yourself, depending on the technology, for example:
# instrumentation for openai
pip install openinference-instrumentation-openai
# opentelemetry libraries
pip install opentelemetry-sdk opentelemetry-exporter-otlp
You can find names of the packages for other libraries in the documentation.
To use auto-instrumentation, you need to add the code like this:
import logging
import os
from time import sleep

from openai import OpenAI

from openinference.instrumentation.openai import OpenAIInstrumentor
from opentelemetry.exporter.otlp.proto.http.trace_exporter import OTLPSpanExporter
from opentelemetry.sdk import trace as trace_sdk
from opentelemetry.sdk.resources import Resource
from opentelemetry.sdk.trace.export import SimpleSpanProcessor

endpoint = "http://otel-collector-opentelemetry-collector.monitoring-demo.svc.cluster.local:4318/v1/traces"
service_name = "random_joke_generator"
tracer_provider = trace_sdk.TracerProvider(resource=Resource(attributes={"service.name": service_name}))
tracer_provider.add_span_processor(SimpleSpanProcessor(OTLPSpanExporter(endpoint)))
OpenAIInstrumentor().instrument(tracer_provider=tracer_provider)

# ... the rest of the code is the same ...
Of course, you need to replace endpoint and service_name with your own values.
And after starting the application, you can see traces in Grafana.
In addition to Python and JavaScript versions, this library also supports Java.
Using OpenLIT
#
And the last library we will look at today is OpenLIT.
OpenLIT SDK is a monitoring framework built on top of OpenTelemetry that gives you complete observability for your AI stack, from LLMs to vector databases and GPUs, enabling tracing and metrics with just one line of code. It also allows you to send the generated traces and metrics to your existing monitoring tools like the VictoriaMetrics Stack.
The library only supports collecting traces and metrics.
The Python implementation of OpenLIT is provided via the openlit package.
You can install it with pip:
pip install openlit
After installing the package, you can use it like this:
import logging
import os
from time import sleep

from openai import OpenAI

import openlit
openlit.init(application_name="random_joke_generator")

# ... the rest of the code is the same ...
After adding auto-instrumentation to your code, to send data to the OpenTelemetry collector, you need to set the following environment variable when starting the application:
# URL to the OpenTelemetry collector:
export OTEL_EXPORTER_OTLP_ENDPOINT="http://otel-collector-opentelemetry-collector.monitoring-demo.svc.cluster.local:4318"
And that’s it! Now you collect traces and metrics and can see them in Grafana.
In addition to the Python version, this library also supports TypeScript.
Visualization
#
Now that you have configured everything and connected signal collection using auto-instrumentation, you can use Grafana to work with telemetry data and visualize it.
You can use datasources in Grafana:
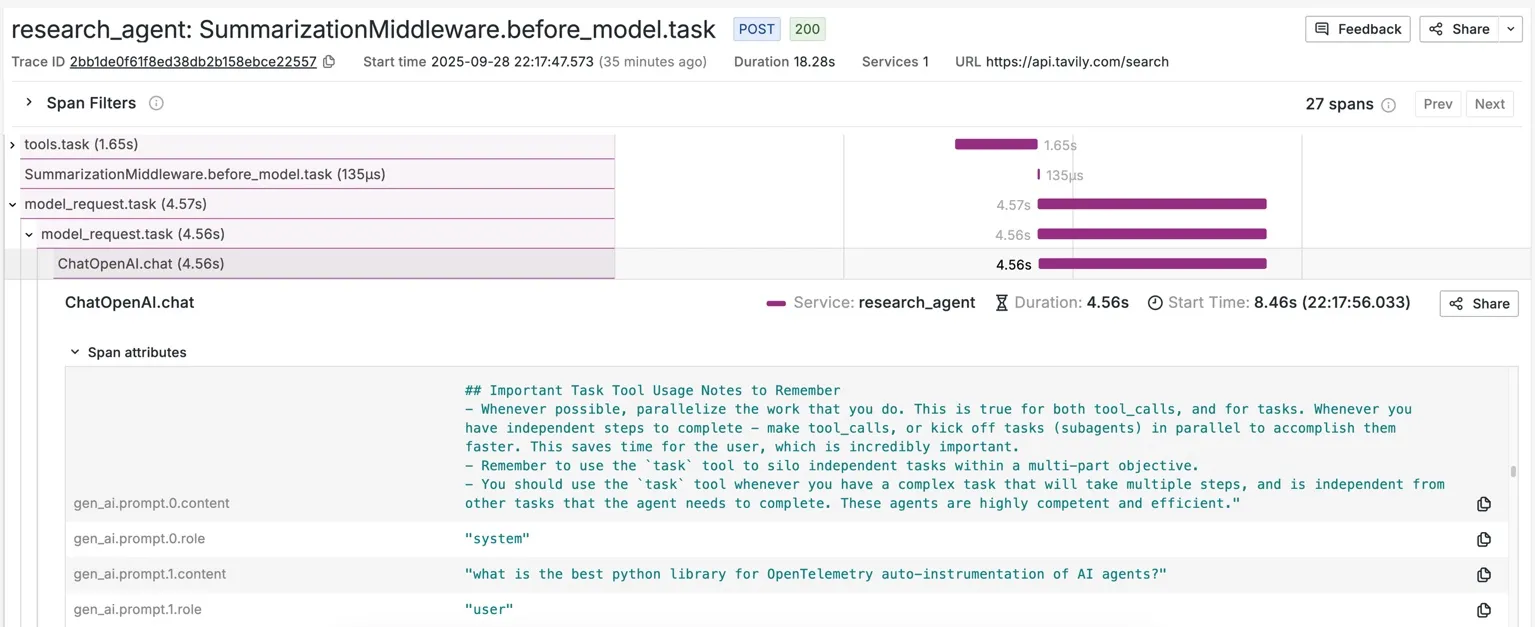
VictoriaTraces datasource to visualize LLM call chains in the form of traces with a lot of useful span fields:
Prompts content, roles, tool calls specifications, models, and other parameters:
Input- and output-token count and response time:
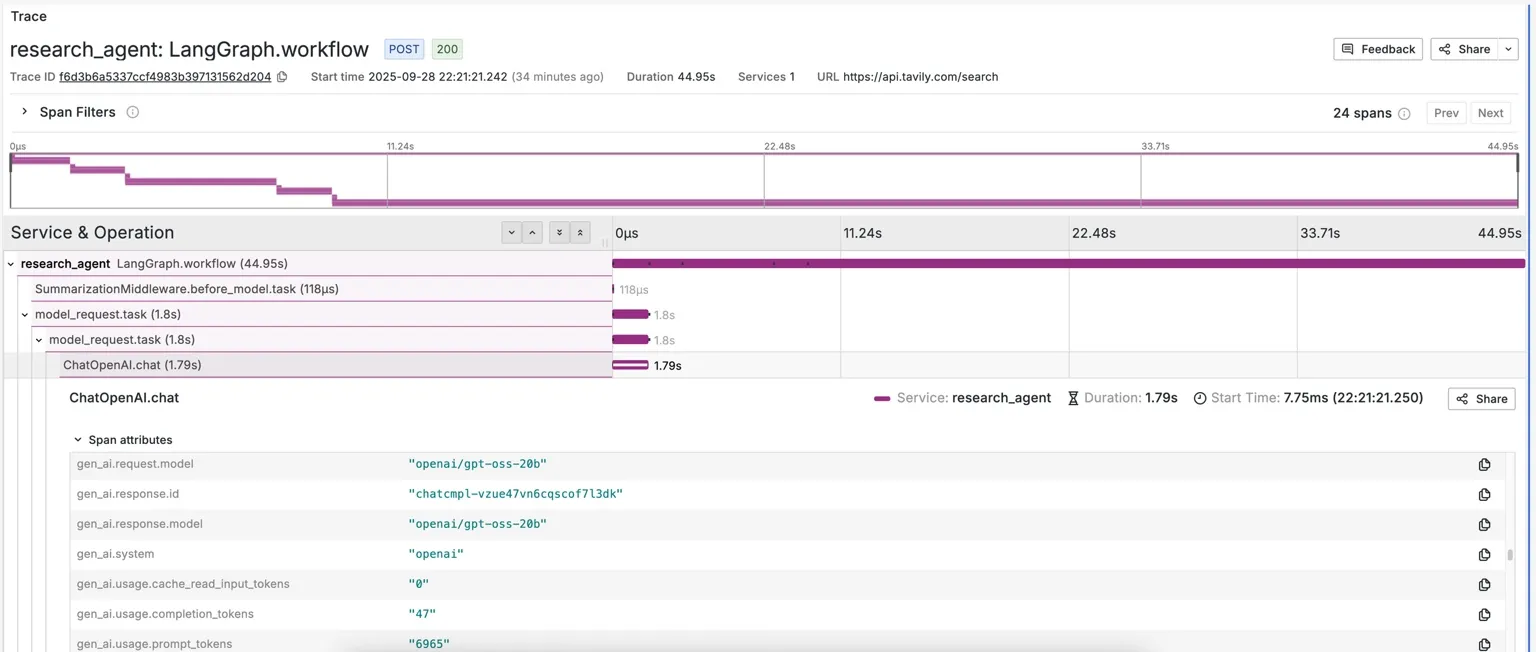
Agent workflow graph with using “Dependency graph” panel of Jaeger plugin for Grafana
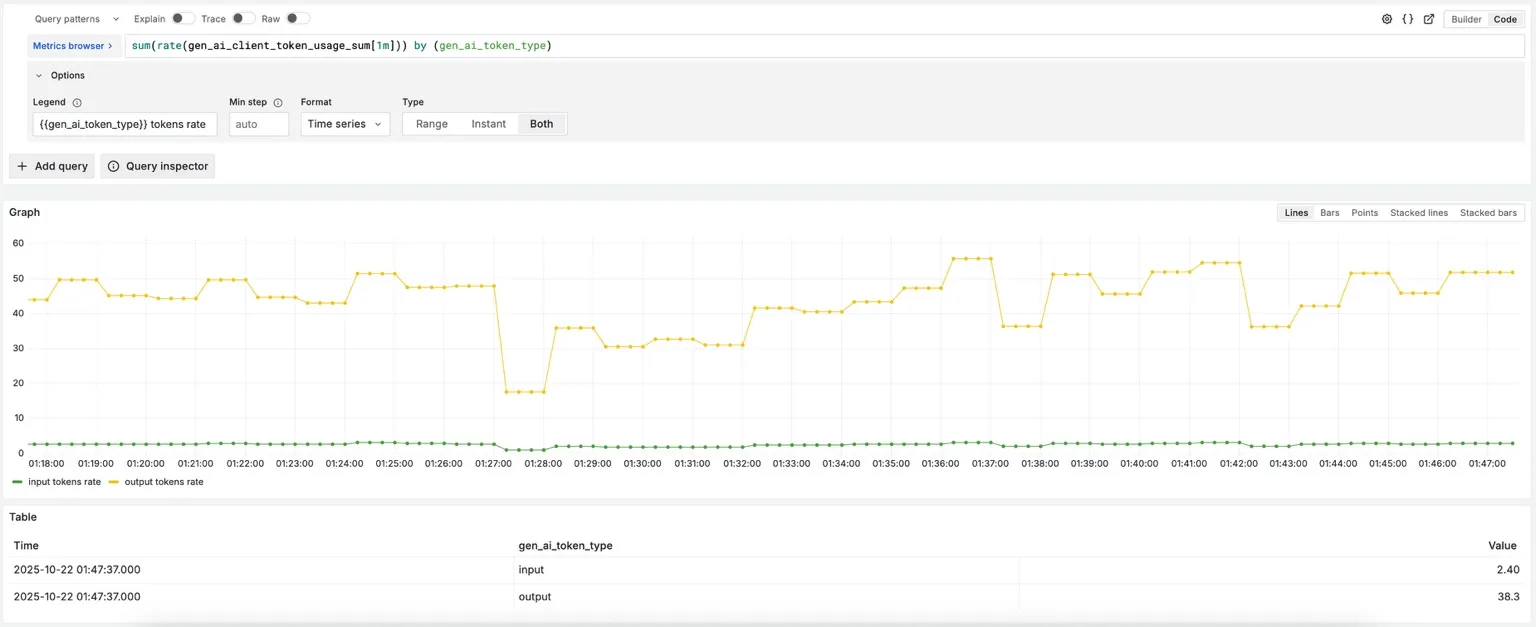
VictoriaMetrics datasource to visualize time series data:
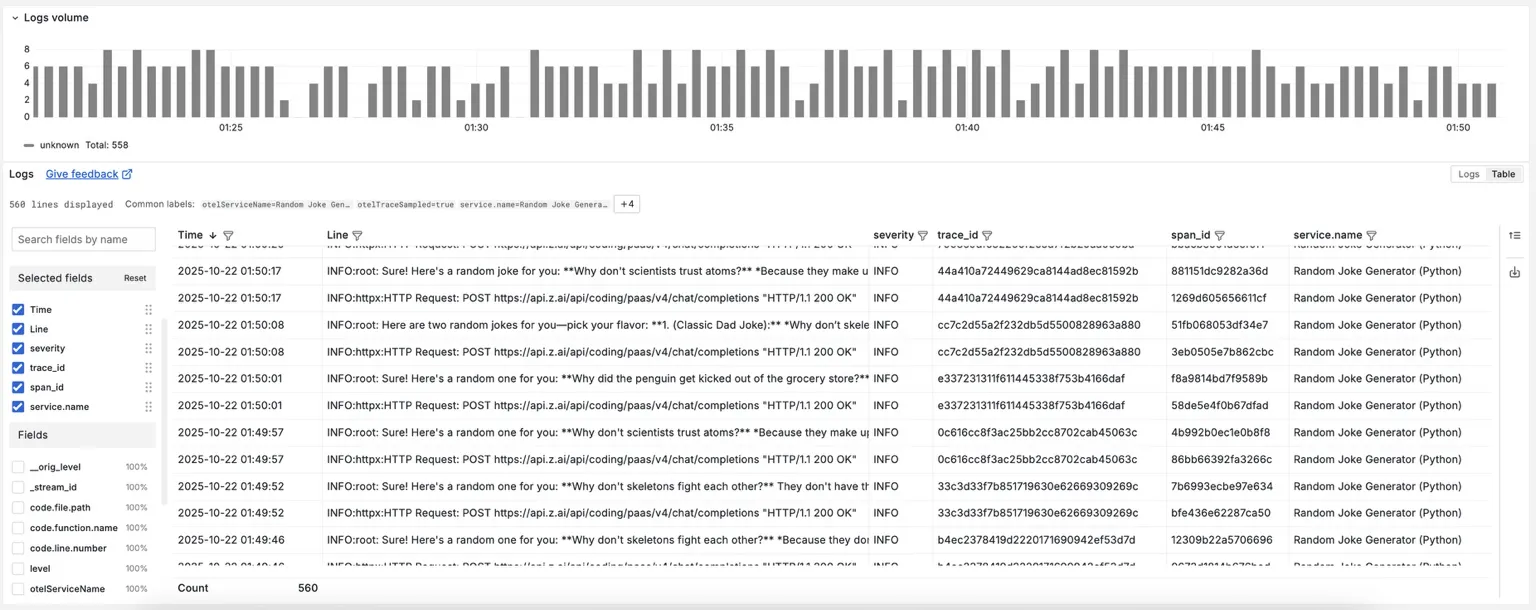
VictoriaLogs datasource to visualize logs (with service name, severity and linked by trace_id, span_id):
Once your agents are instrumented and sending data to the VictoriaMetrics Stack, you can create comprehensive dashboards based on the data.
Conclusion
#
High-quality observability for AI agents is no longer a moonshot project. OpenTelemetry already gives us the common language for describing model calls, tool hops, and retrieval steps, while the VictoriaMetrics Stack stores every signal economically and provides a cost-efficient backend for analyzing metrics, logs, and traces. With auto-instrumentation libraries you can use existing approaches to observability after that.
What’s the result? Let’s recap the wins:
- We didn’t have to write custom logic for every app – the instrumentation libraries provided rich context out-of-the-box: with just a few lines of code, we instrumented our AI app to automatically capture every prompt, response, latency, and token count.
- We configured one endpoint, and now we have end-to-end traces flowing into our observability stack.
- Developers of all backgrounds can quickly gain the insights they need to understand their AI agents better, debug them faster, improve their performance, and reduce their costs over time. And thanks to semantic conventions, dashboards and traces look the same whether you use OpenAI, Anthropic, Ollama, LangChain, or any other framework.
- We can set up dashboards, alerts for our AI apps, and even use MCP servers for the VictoriaMetrics Stack (mcp-victoriametrics, mcp-victorialogs, mcp-victoriatraces) to get insights about them using AI.
Happy observing!
Leave a comment below or Contact Us if you have any questions!
comments powered by Disqus